If the May 28 kickoff meeting was any indication, it’s going to be a busy summer for the more than 80 students participating in Duke’s summer research program, Data+.

Offered through the Rhodes Information Initiative at Duke (iiD), Data+ is a 10-week summer program with a focus on data-driven research. Participants come from varied backgrounds in terms of majors and experience. Project themes range from health, public policy, energy and environment, and interdisciplinary inquiry.
“It’s like a language immersion camp, but for data science,” said Ariel Dawn, Rhodes iiD Events & Communication Specialist. “The kids are going to have to learn some of those [programming] languages like Java or Python to have their projects completed,” Dawn said.
Dawn, who previously worked for the Office of the Vice Provost for Research, arrived during the program’s humble beginnings in 2015. Data+ began in 2014 as a small summer project in Duke’s math department funded by a grant from the National Science Foundation. The following year the program grew to 40 students, and it has grown every year since.
Today, the program also collaborates with the Code+ and CS+ summer programs, with more than 100 students participating. Sponsors have grown to include major corporations such as Exxonmobil, which will fund two Data+ projects on oil research within the Gulf of Mexico and the United Kingdom in 2019.
“It’s different than an internship, because an internship you’re kind of told what to do,” said Kathy Peterson, Rhodes iiD Business Manager. “This is where the students have to work through different things and make discoveries along the way,” Peterson said.
From late May to July, undergraduates work on a research project under the supervision of a graduate student or faculty advisor. This year, Data+ chose more than 80 eager students out of a pool of over 350 applicants. There are 27 projects being featured in the program.
Over the summer, students are given a crash course in data science, how to conduct their study and present their work in front of peers. Data+ prioritizes collaboration as students are split into teams while working in a communal environment.
“Data is collected on you every day in so many different ways, sometimes we can do a lot of interesting things with that,” Dawn said. “You can collect all this information that’s really granular and relates to you as an individual, but in a large group it shows trends and what the big picture is.”
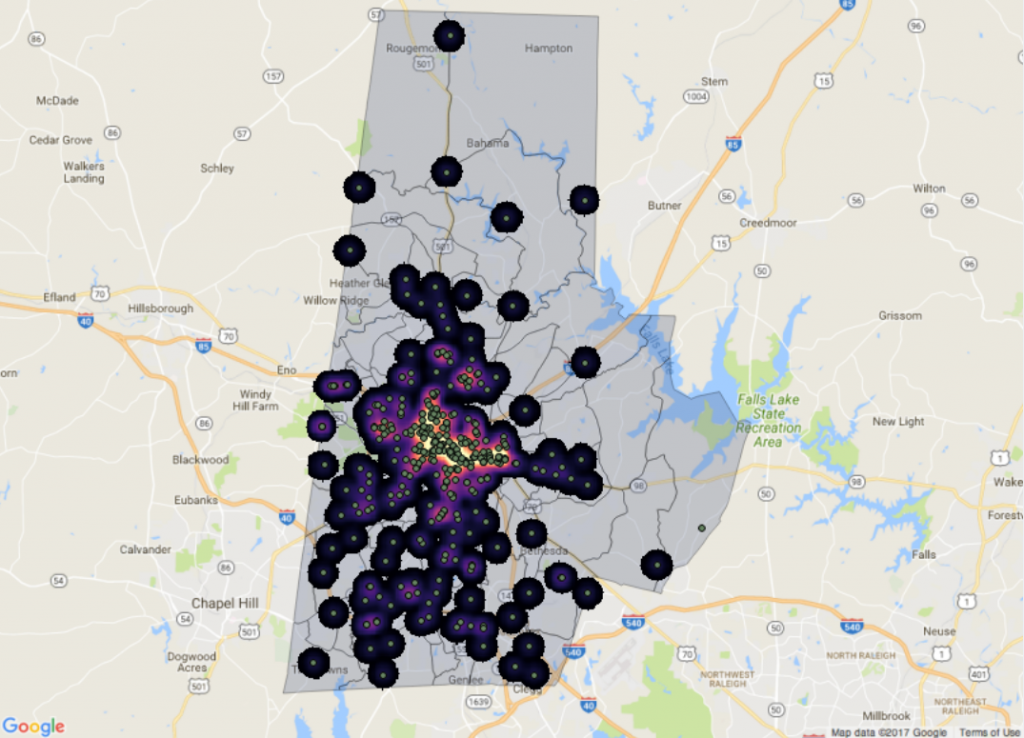
Data+ students also delve into real world issues. Since 2013, Duke professor Jonathan Mattingly has led a student-run investigation on gerrymandering in political redistricting plans through Data+ and Bass Connections. Their analysis became part of a 205-page Supreme Court ruling.
The program has also made strides to connect with the Durham community. In collaboration with local company DataWorks NC, students will examine Durham’s eviction data to help identify policy changes that could help residents stay in their homes.
“It [Data+] gives students an edge when they go look for a job,” Dawn said. “We hear from so many students who’ve gotten jobs, and [at] some point during their interview employers said, ‘Please tell us about your Data+ experience.’”
From finding better sustainable energy to examining story adaptations within books and films, the projects cover many topics.
A project entitled “Invisible Adaptations: From Hamlet to the Avengers,” blends algorithms with storytelling. Led by UNC-Chapel Hill grad student Grant Class, students will make comparisons between Shakespeare’s work and today’s “Avengers” franchise.
“It’s a much different vibe,” said computer science major Katherine Cottrell. “I feel during the school year there’s a lot of pressure and now we’re focusing on productivity which feels really good.”
Cottrell and her group are examining the responses to lakes affected by multiple stressors.
Data+ concludes with a final poster session on Friday, August 2, from 2 p.m. to 4 p.m. in the Gross Hall Energy Hub. Everyone in the Duke Community and beyond is invited to attend. Students will present their findings along with sister programs Code+ and the summer Computer Science Program.

Art by Maya O’Neal (right)


 Guest post by Paris Geolas, a senior at the North Carolina School of Science and Math

 What is morphogenesis? Morphogenesis examines the development of the living organisms’ forms.
  Can morphogenesis make sense of these differences? Through mathematical modeling, two stimuli for shoots’ shapes was determined: gravity and itself. Additionally, elasticity as a function of the shoots’ weight plays a role in the mathematical models of plant shoots’ shapes which appear in