
DURHAM, N.C. — It’s been five years since Durham expanded its smoking ban beyond bars and restaurants to include public parks, bus stops, even sidewalks.
While smoking in the state overall may be down, 19 percent of North Carolinians still light up, particularly the poor and those without a high school or college diploma.
Among North Carolina teens, consumption of electronic cigarettes in particular more than doubled between 2013 and 2015.
Now, new maps created by students in the Data+ summer research program show where nicotine addicts can get their fix.
Studies suggest that tobacco retailers are disproportionately located in low-income neighborhoods.
Living in a neighborhood with easy access to stores that sell tobacco makes it easier to start young and harder to quit.
The end result is that smoking, secondhand smoke exposure, and smoking-related diseases such as lung cancer, are concentrated among the most socially disadvantaged communities.

If you’re poor and lack a high school or college diploma, you’re more likely to live near a store that sells tobacco. Photo from Pixabay.
Where stores that sell tobacco are located matters for health, but for many states such data are hard to come by, said Duke statistics major James Wang.
Tobacco products bring in more than a third of in-store sales revenue at U.S. convenience stores — more than food, beverages, candy, snacks or beer. Despite big profits, more than a dozen states don’t require businesses to get a special license or permit to sell tobacco. North Carolina is one of them.
For these states, there is no convenient spreadsheet from the local licensing agency identifying all the businesses that sell tobacco, said Duke undergraduate Nikhil Pulimood. Previous attempts to collect such data in Virginia involved searching for tobacco retail stores by car.
“They had people physically drive across every single road in the state to collect the data. It took three years,” said team member and Duke undergraduate Felicia Chen.
Led by UNC PhD student in epidemiology Mike Dolan Fliss, the Duke team tried to come up with an easier way.
Instead of collecting data on the ground, they wrote an automated web-crawler program to extract the data from the Yellow Pages websites, using a technique called Web scraping.
By telling the software the type of business and location, they were able to create a database that included the names, addresses, phone numbers and other information for 266 potential tobacco retailers in Durham County and more than 15,500 statewide, including chains such as Family Fare, Circle K and others.
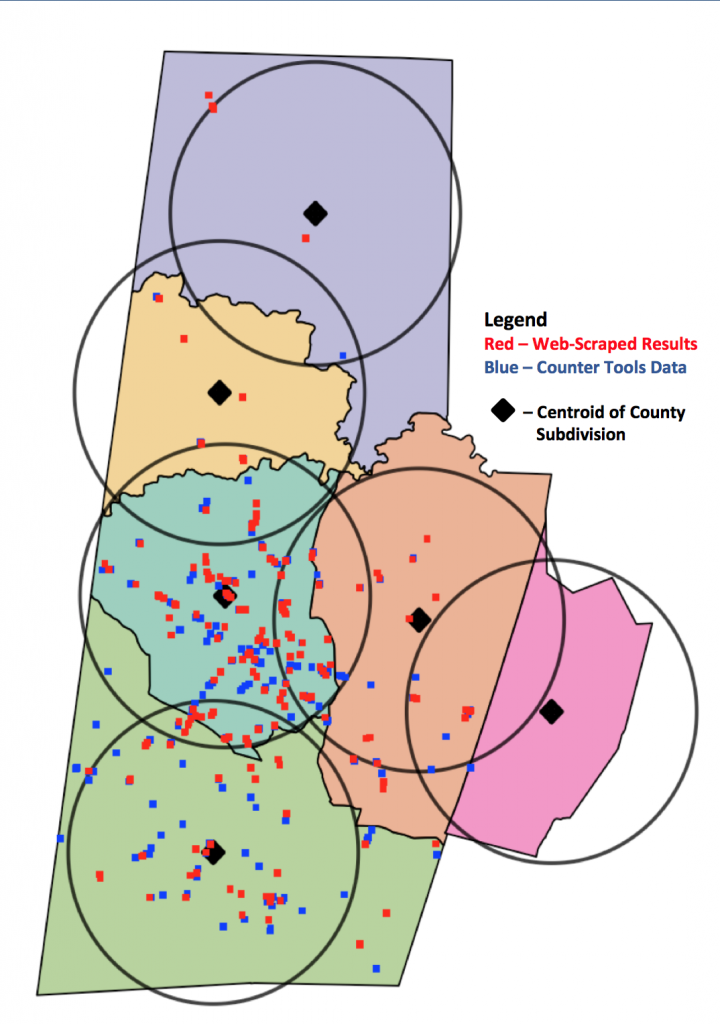
Map showing the locations of tobacco retail stores in Durham County, North Carolina.
When they compared their web-scraped data with a pre-existing dataset for Durham County, compiled by a nonprofit called Counter Tools, hundreds of previously hidden retailers emerged on the map.
To determine which stores actually sold tobacco, they fed a computer algorithm data from more than 19,000 businesses outside North Carolina so it could learn how to distinguish say, convenience stores from grocery stores. When the algorithm received store names from North Carolina, it predicted tobacco retailers correctly 85 percent of the time.
“For example we could predict that if a store has the word “7-Eleven” in it, it probably sells tobacco,” Chen said.
As a final step, they also crosschecked their results by paying people a small fee to search for the stores online to verify that they exist, and call them to ask if they actually sell tobacco, using a crowdsourcing service called Amazon Mechanical Turk.
Ultimately, the team hopes their methods will help map the more than 336,000 tobacco retailers nationwide.
“With a complete dataset for tobacco retailers around the nation, public health experts will be able to see where tobacco retailers are located relative to parks and schools, and how store density changes from one neighborhood to another,” Wang said.
The team presented their work at the Data+ Final Symposium on July 28 in Gross Hall.
Data+ is sponsored by Bass Connections, the Information Initiative at Duke, the Social Science Research Institute, the departments of mathematics and statistical science and MEDx. This project team was also supported by Counter Tools, a non-profit based in Carrboro, NC.

Writing by Robin Smith; video by Lauren Mueller and Summer Dunsmore

 Post by Meg Shieh.


 Guest Post by Kendra Zhong, North Carolina School of Science and Math, Class of 2017

 Guest post by Raechel Zeller, North Carolina School of Science and Math, Class of 2017

 Post by Karl Leif Bates

 Guest Post by Eric Ferreri, Duke News and Communications

 Post by Meg Shieh