Following the people and events that make up the research community at Duke

Students exploring the Innovation Co-Lab

Category: Students Page 18 of 42

Math on the Basketball Court

Boston Celtics data analyst David Sparks, Ph.D, really knew his audience Thursday, November 8, when he gave a presentation centered around the two most important themes at Duke: basketball and academics. He gave the crowd hope that you don’t have to be a Marvin Bagley III to make a career out of basketball — in fact, you don’t have to be an athlete at all; you can be a mathematician.

David Sparks (photo from Duke Political Science)

Sparks loves basketball, and he spends every day watching games and practices for his job. What career fits this description, you might ask? After graduating from Duke in 2012 with a Ph.D. in Political Science, Sparks went to work for the Boston Celtics, as the Director of Basketball Analytics. His job entails analyzing basketball data and building statistical models to ensure that the team will win.

The most important statistic when looking at basketball data is offensive / defensive efficiency, Sparks told the audience gathered for the “Data Dialogue” series hosted by the Information Initiative at Duke. Offensive efficiency translates to the number of points per possession while defensive efficiency measures how poorly the team forced the other offense to perform. These are measured with four factors: effective field goal percentage (shots made/ shots taken), turnover rate, successful rebound percentage, and foul rate. By looking at these four factors for both offensive and defensive efficiency, Sparks can figure out which of these areas are lacking, and share with the coach where there is room for improvement. “We all agree that we want to win, and the way you win is through efficiency,” Sparks said.

Since there is not a lot of room for improvement in the short windows between games during the regular season, a large component of Sparks’ job involves informing the draft and how the team should run practices during preseason.

David Sparks wins over his audience by showing Duke basketball clips to illustrate a point. Sparks spoke as part of the “Data Dialogue” series hosted by the Information Initiative at Duke.

Data collection these days is done by computer software. Synergy Sports Technology, the dominant data provider in professional basketball, has installed cameras in all 29 NBA arenas. These cameras are constantly watching and coding plays during games, tracking the locations of each player and the movements of the ball. They can analyze the amount of times the ball was touched and determine how long it was possessed each time, or recognize screens and calculate the height at which rebounds are grabbed. This software has revolutionized basketball analytics, because the implication of computer coding is that data scientists like Sparks can go back and look for new things later.

The room leaned in eagerly as Sparks finished his presentation, intrigued by the profession that is interdisciplinary at its core — an unlikely combination of sports and applied math. If math explains basketball, maybe we can all find a way to connect our random passions in the professional sphere.

Meet New Blogger Anne Littlewood – Working on Biology and Puppies

My name is Anne Littlewood and I am a sophomore here at Duke. I grew up in San Francisco, spent a brief moment living on the island of Kauai, and finished high school in Pebble Beach, California. I am studying the intersection of biology and psychology here at Duke, in an effort to understand how biological mechanisms inform our interactions with the environment.

Snuggles in Puppy Kindergarten!

Outside the classroom, I can be found frequenting Duke’s beloved Puppy Kindergarten, where I work as a volunteer. Recently, I’ve become an Associate Editor for Duke’s literary magazine, The Archive. I love writing creatively, and it’s been so great to find a community of my literature- loving peers. I’m also participating in a Bass Connections project this year, and working on a team to evaluate the outcomes of different conservation interventions through the synthesis of an evidence gap map for World Wildlife fund.

Me and Cricket on Carmel Beach

Most of all I love to spend time outdoors, whether it’s exploring the mountains of North Carolina on a backpacking trip, lying in my hammock at Eno Quarry, or walking through the gardens each day on my way to class. I’m a huge animal lover, and I’m way too obsessed with my dog, a 12-pound cavalier King Charles spaniel named Cricket.

I’ve always been into science, but I think I really fell in love with Biology my freshman year of high school, when my all time favorite teacher, Mr. Cinti helped me extract my DNA one afternoon, just for fun. Writing is my passion, and I’m excited to explore my skills in a variety of genres this year. This blog is my first ever attempt at journalism/ science writing, and I’m excited to give it a try!

Coding: A Piece of Cake

Image result for cake

Imagine a cake, your favorite cake. Has your interest been piqued?

“Start with Cake” has proved an effective teaching strategy for Mine Cetinkaya-Rundel in her introduction-level statistics classes. In her talk “Teaching Computing via Visualization,” she lays out her classroom approaches to helping students maintain an interest in coding despite its difficulty. Just like a cooking class, a taste of the final product can motivate students to master the process. Cetinkaya-Rundel, therefore, believes that instead of having students begin with the flour and sugar and milk, they should dive right into the sweet frosting. While bringing cake to the first day of class has a great success rate for increasing a class’s attention span (they’ll sugar crash in their next classes, no worries), what this statistics professor actually refers to is showing the final visualizations. By giving students large amounts of pre-written code and only one or two steps to complete during the first few class periods, they can immediately recognize coding’s potential. The possibilities become exciting and capture their attention so that fewer students attempt to vanish with the magic of drop/add period. For the student unsure about coding, immediately writing their own code can seem overwhelming and steal the joy of creating.

Example of a visualization Cetinkaya-Rundel uses in her classes

To accommodate students with less background in coding, Cetinkaya-Rundel believes that skipping the baby steps proves a better approach than slowing the pace. By jumping straight into larger projects, students can spend more time wrestling their code and discovering the best strategies rather than memorizing the definition of a histogram. The idea is to give the students everything on day one, and then slowly remove the pre-written coding until they are writing on their own. The traditional classroom approach involves teaching students line-by-line until they have enough to create the desired visualizations. While Cetinkaya-Rundel admits that her style may not suit every individual and creating the assignments does require more time, she stands by her eat-dessert-first perspective on teaching. Another way she helps students maintain their original curiosity is by cherishing day one through pre-installed packages which allow students to start playing with visualizations and altering code right away.

Not only does Cetinkaya-Rundel give mouth-watering cakes as the end results for her students but she also sometimes shows them burnt and crumbling desserts. “People like to critique,” she explains as she lays out how to motivate students to begin writing original code. When she gives her students a sloppy graph and tells them to fix it, they are more likely to find creative solutions and explore how to make the graph most appealing to them. As the scaffolding falls away and students begin diverging from the style guides, Cetinkaya-Rundel has found that they have a greater understanding of and passion for coding. A spoonful of sugar really does help the medicine go down.  

    Post by Lydia Goff

Creating a Gender Inclusive Campus: Reflecting on “Becoming Johanna”

Following Duke’s Oct. 4 screening of the 2016 documentary, “Becoming Johanna,” students, faculty, staff and community members in the audience were eager to ask questions of the panel, which included the film’s director/producer, Jonathan Skurnik, and even the film’s transgender subject, Johanna Clearwater herself.

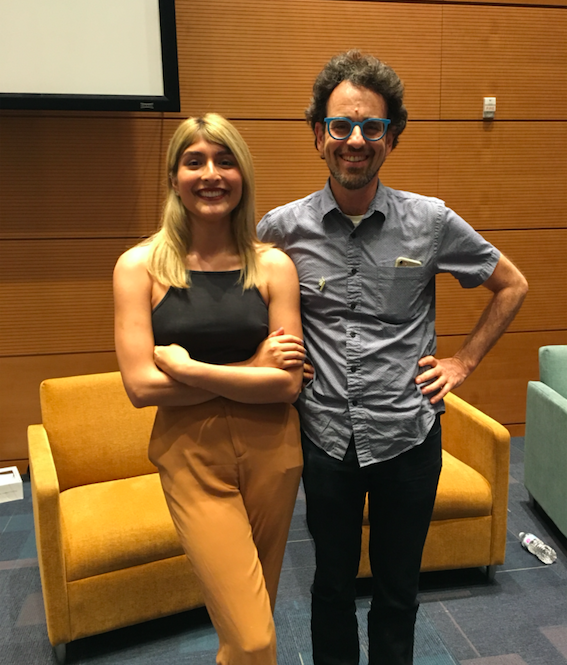
Johanna Clearwater pictured with the film’s director/producer Jonathan Skurnik

The film showcases the heart-wrenching and empowering story of a latina transgender teenager growing up in Los Angeles. After beginning her transition at age 16, Johanna faced the rejection of her mother and intense opposition from school authorities. Soon after, she was abandoned by her family and entered the foster care system, where she was lucky to find a much more supportive family environment. After changing schools, she connected on a personal level with her school principal, Deb, who helped Johanna find a community where she felt understood and supported. This success story of self-advocacy and resilience in the face of abandonment and exclusion highlights the daily struggles of many transgender teenagers. For these individuals, becoming comfortable in their own skin is the end of a long and demanding journey, often made even more difficult by the ignorance and cruelty of society. Finding and following the path to authentic expression takes a huge amount of courage, as this route is often layered with adversity.

Before the screening, Duke clinical social worker Kristin Russel put the film in context for the audience, inviting our reflection with her words: “A well told story… is really what can help us bridge the unfortunate distance that can remain uncrossed and misunderstood if such stories are silenced.” Chief Diversity Officer for the School of Medicine Judy Seidenstein then introduced the film and facilitated the panel discussion.

After the film, the audience was invited to join the conversation. Questions came from every demographic of the crowd, and provided a nice sampling of opinions. Many audience members pointed out how important these conversations are, especially in a conservative state like North Carolina that has so recently struggled with the protection of LGBTQ rights with last year’s ‘Bathroom Bill.’ Specifically, the questions and comments from hospital staff and faculty from the School of Medicine gave a nice insight into the direction of support on campus for sexual and gender diversity.

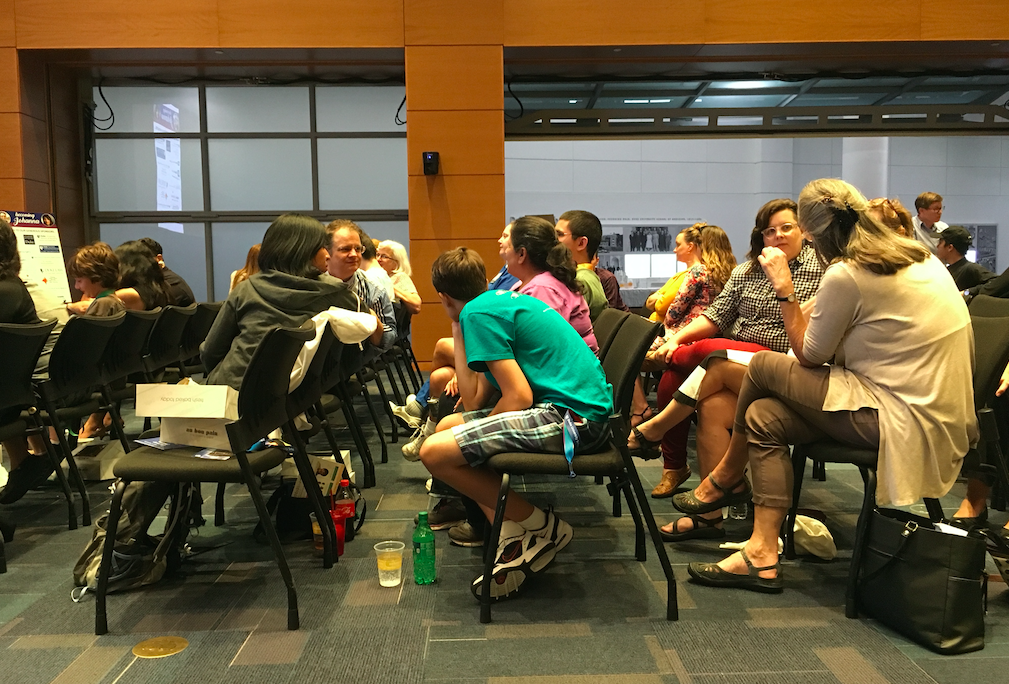
Audience members reflect on the film with those nearby

Cheryl Brewer, the Associate Vice President of Nursing, told the room about the inclusion work that she is leading in the School of Nursing. They have developed a new core curriculum to promote acceptance and support of gender and sexual diversity through situational trainings. She noted that there have been some people that struggle with implicit biases more than others, but that the program has been a success overall.

Russell spoke briefly about her work with transgender and gender diverse youth in the clinical setting and emphasized the importance of having family support. Legally and psychologically, maintaining family involvement and support of patients is essential for treatment.

Events like this one reflect ongoing efforts to support sexual and gender diversity within and beyond Duke, by promoting conversation and increasing empathy through storytelling. Duke is well on the way to becoming a much more inclusive community, where everyone can feel a sense of belonging.

Guest post by Anne Littlewood

Meet New Blogger Brian Du

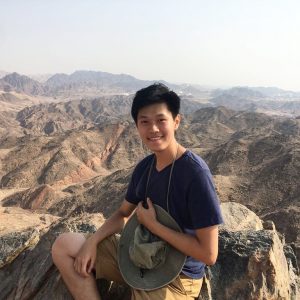
Brian survives his week in the desert.

Hi! My name is Brian Du, and I’m a sophomore from Texas. I’m a pre-med majoring in computer science. I like vacations, hiking, and hiking on vacation. Besides these hobbies, I also love learning about science and hearing a good story. These latter two are exactly why I’m excited to be writing for the Duke Research Blog.

My first exposure to science happened in third grade because my goldfish kept getting sick and dying. This made me sad and I became invested in making them well again. I would measure pH levels regularly with my dad and keep notes on the fishes’ health. Eventually the process turned into a science fair project. I remember I loved presenting because I got to point out to the judges the ‘after’ pictures of my fish, which showed them alive, healthy, and happy (I think? it’s hard to tell with fish).

One happy fish!
Source: Reddit

My fish and I go way back.

After that third-grade experiment, I kept doing science projects — almost year after year actually — since I love the research process. From framing the right questions and setting up the experiment, to running the trials and writing up and sharing my work, my enthusiasm grew with each step. Come competition day, I noticed that in interviews that went well, my excitement was contagious, so that judges grew more eager too as they listened. And so I understood: a huge part to science is communication. Science, like food or a good story, is meant to be shared with others. The scientist is a storyteller, adjusting his presentation to captivate different audiences. With judges, I spoke jargon, but during public exhibition, where I chatted with anyone who came up to me, I got creative when asked about my research. Analogies helped me link strange concepts to everyday objects and experiences. An important protein channel became a pipe, and its inhibitor molecule a rock which would clog the pipe to make it unusable.

protein channel “pipe”
edited from CThompson02

Now that I’m at Duke, there’s so many stories to tell of the rich variety of research being done right on campus! I’ve written a few articles for the Chronicle covering some of the new medicine or proteins Duke professors have been involved in developing. As I keep an ear out for more stories, I hope to share a few of them in my upcoming posts, because I know they’ll be exciting!

New Blogger Rebecca Williamson: The Moon and Some Stars

Hello! My name is Rebecca Williamson, and I am a freshman here at Duke University. Coming into college, I plan to major in economics, but that could very well change. As for my interests outside of the classroom, I enjoy singing and theater and am a member of Out of the Blue, one of the all-female a cappella groups here at Duke!

Rebecca Williamson, Duke 2022

Rebecca Williamson, Duke 2022

I fell in love with Duke the second I stepped on campus. I am excited to see what Duke has to offer me, but more importantly, what I can offer to Duke.

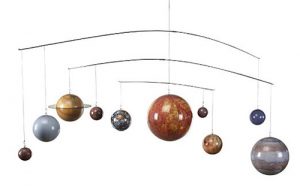
My interest in science, specifically astronomy, was piqued at a very young age. By age six, I had not one, but three,  Moon in my Room light up toys (remote controlled models of the Moon that scrolled through the waxing and waning phases of the Moon at the touch of a button) mounted in my bedroom. By nine, I had the entire planetary system (yes, including Pluto) hanging from my ceiling. Though I cannot say that my interests remain with astronomy, it is what first got me invested in science. I have since gained interest in the natural sciences and animal sciences, though every so often I do press some of the buttons on my Moon in my Room remote.

Some random boy imagines he's as cool as six-year-old Rebecca.

Some random boy imagines he’s as cool as six-year-old Rebecca.

My love of writing, however, was spawned by my love of theater. As an active member of my high school’s theater community, I was roped into being a part of, and eventually became the president, of my school’s Cappies Critics team. As a Cappie, I was expected to watch local high school plays and musicals and write critical, holistic reviews of them. This program jump-started my love for writing and helped me to develop my own unique journalistic voice.

solar system mobile. www.luxrysale.comI hope to combine my interest in the natural and animal sciences with my love for writing and chronicle some of the amazing research going on in these fields both on campus and around Durham! I also hope to incorporate my interests in music and theater into my inquiries and document scientific research surrounding music and the arts in the Duke community.

Duke University Research Blog, look out, because here I come!

Post by Rebecca Williamson

New Blogger: Victoria Priester Loves Animals and Books

Hi! My name is Victoria Priester, and I’m a sophomore at Duke and one of this year’s new Duke Research bloggers.

Victoria meeting a very intelligent mammal.

I’m pre-vet, but I’ve always been a bookworm and have a love for expressing myself through writing that has given me a strained relationship with word counts. I’ll try to keep this intro post brief!

I’m majoring in English in addition to taking pre-veterinary classes, so my time in the library so far this year has been spent alternating between drawing resonance structures for organic chemistry and reading Jane Eyre in the Gothic Reading Room, which is my favorite study spot on campus.

Effective puppy medicine includes hugging and kissing.

I grew up in the suburbs of Washington, D.C. and now I work in the veterinary department at Duke Lemur Center. I’m also an editor and opinion columnist for The Chronicle. My favorite part of the academic scene at Duke is that pursuing such different interests at the same time is encouraged.

This year, I’m a part of the Bass Connections team that is studying how using expressive writing for resilience can help cancer patients process their experiences during treatment. I love finding new ways to connect my passion for writing with my interest in science, conservation and zoology.

One of the reasons I want to be a veterinarian is because I think veterinarians can and do play a crucial role in species conservation in zoos and animal sanctuaries. However, there is still a lot left to be learned about the animal species they care for.

For example, there is a species of lemur that consistently develops dental problems in captivity that lead to tooth loss, so there must be something about its diet in captivity compared to its diet in Madagascar that affects the health of its teeth. I care a lot about research concerning animals, conservation and pets, in addition to the health benefits of cathartic writing.

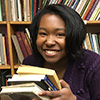
Victoria REALLY likes books.

I follow National Geographic on Twitter and read their articles as often as I can, but I usually end up just telling all of the cool facts I just learned to my parents, close friends or anyone else who is close enough to me to feel a slight obligation to listen and feign interest.

Through blogging, I hope to find a platform to synthesize new scientific findings surrounding animals, marine life or cathartic writing and post them to a place where people who care about and want to read about these topics can find them.

Post by Victoria Priester

Medicine, Research and HIV

Duke senior Jesse Mangold has had an interest in the intersection of medicine and research since high school. While he took electives in a program called “Science, Medicine, and Research,” it wasn’t until the summer after his first year at Duke that he got to participate in research.

As a member of the inaugural class of Huang fellows, Mangold worked in the lab of Duke assistant professor Christina Meade on the compounding effect of HIV and marijuana use on cognitive abilities like memory and learning.

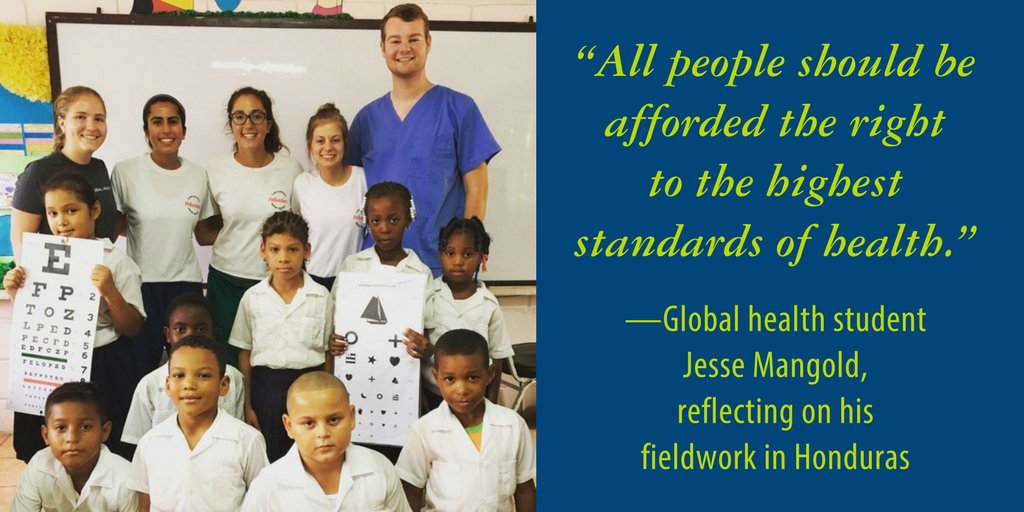
The following summer, Mangold traveled to Honduras with a group of students to help with collecting data and also meeting the overwhelming need for eye care. Mangold and the other students traveled to schools, administered visual exams, and provided free glasses to the children who needed them. Additionally, the students contributed to a growing research project, and for their part, put together an award-winning poster.

Mangold’s (top right) work in Honduras helped provide countless children with the eye care they so sorely needed.

Returning to school as a junior, Mangold wanted to focus on his greatest research interest: the molecular mechanisms of human immunodeficiency virus (HIV). Mangold found a home in the Permar lab, which investigates mechanisms of mother-to-child transmission of viruses including HIV, Zika, and Cytomegalovirus (CMV).

From co-authoring a book chapter to learning laboratory techniques, he was given “the opportunity to fail, but that was important, because I would learn and come back the next week and fail a little bit less,” Mangold said.

In the absence of any treatment, mothers who are HIV positive transmit the virus to their infants only 30 to 40 percent of the time, suggesting a component of the maternal immune system that provides at least partial protection against transmission.

The immune system functions through the activity of antibodies, or proteins that bind to specific receptors on a microbe and neutralize the threat they pose. The key to an effective HIV vaccine is identifying the most common receptors on the envelope of the virus and engineering a vaccine that can interact with any one of these receptors.

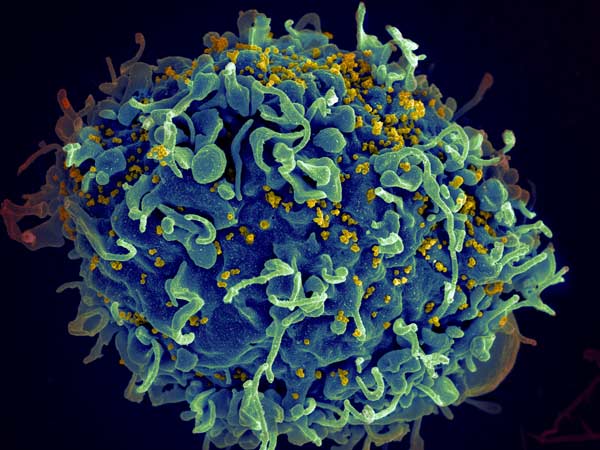
This human T cell (blue) is under attack by HIV (yellow), the virus that causes AIDS. Credit: Seth Pincus, Elizabeth Fischer and Austin Athman, National Institute of Allergy and Infectious Diseases, National Institutes of Health

This human T cell (blue) is under attack by HIV (yellow), the virus that causes AIDS. Credit: Seth Pincus, Elizabeth Fischer and Austin Athman, National Institute of Allergy and Infectious Diseases, National Institutes of Health

Mangold is working with Duke postdoctoral associate Ashley Nelson, Ph.D., to understand the immune response conferred on the infants of HIV positive mothers. To do this, they are using a rhesus macaque model. In order to most closely resemble the disease path as it would progress in humans, they are using a virus called SHIV, which is engineered to have the internal structure of simian immunodeficiency virus (SIV) and the viral envelope of HIV; SHIV can thus serve to naturally infect the macaques but provide insight into antibody response that can be generalized to humans.

The study involves infecting 12 female monkeys with the virus, waiting 12 weeks for the infection to proceed, and treating the monkeys with antiretroviral therapy (ART), which is currently the most effective treatment for HIV. Following the treatment, the level of virus in the blood, or viral load, will drop to undetectable levels. After an additional 12 weeks of treatment and three doses of either a candidate HIV vaccine or a placebo, treatment will be stopped. This design is meant to mirror the gold-standard of treatment for women who are HIV-positive and pregnant.

At this point, because the treatment and vaccine are imperfect, some virus will have survived and will “rebound,” or replicate fast and repopulate the blood. The key to this research is to sequence the virus at this stage, to identify the characteristics of the surviving virus that withstood the best available treatment. This surviving virus is also what is passed from mothers on antiretroviral therapy to their infants, so understanding its properties is vital for preventing mother-to-child transmission.

As a Huang fellow, Mangold had the opportunity to present his research on the compounding effect of HIV and marijuana on cognitive function.

Mangold’s role is looking into the difference in viral diversity before treatment commences and after rebound. This research will prove fundamental in engineering better and more effective treatments.

In addition to working with HIV, Mangold will be working on a project looking into a virus that doesn’t receive the same level of attention as HIV: Cytomegalovirus. CMV is the leading congenital cause of hearing loss, and mother-to-child transmission plays an important role in the transmission of this devastating virus.

Mangold and his mentor, pediatric resident Tiziana Coppola, M.D., are authoring a paper that reviews existing literature on CMV to look for a link between the prevalence of CMV in women of child-bearing age and whether this prevalence is predictive of the number of children suffer CMV-related hearing loss. With this study, Mangold and Coppola are hoping to identify if there is a component of the maternal immune system that confers some immunity to the child, which can then be targeted for vaccine development.

After graduation, Mangold will continue his research in the Permar lab during a gap year while applying to MD/PhD programs. He hopes to continue studying at the intersection of medicine and research in the HIV vaccine field.

Post by undergraduate blogger Sarah Haurin

Post by undergraduate blogger Sarah Haurin


What Happens When Data Scientists Crunch Through Three Centuries of Robinson Crusoe?

Reading 1,400-plus editions of “Robinson Crusoe” in one summer is impossible. So one team of students tried to train computers to do it for them.

Reading 1,400-plus editions of “Robinson Crusoe” in one summer is impossible. So one team of students tried to train computers to do it for them.

Since Daniel Defoe’s shipwreck tale “Robinson Crusoe” was first published nearly 300 years ago, thousands of editions and spinoff versions have been published, in hundreds of languages.

A research team led by Grant Glass, a Ph.D. student in English and comparative literature at the University of North Carolina at Chapel Hill, wanted to know how the story changed as it went through various editions, imitations and translations, and to see which parts stood the test of time.

Reading through them all at a pace of one a day would take years. Instead, the researchers are training computers to do it for them.

This summer, Glass’ team in the Data+ summer research program used computer algorithms and machine learning techniques to sift through 1,482 full-text versions of Robinson Crusoe, compiled from online archives.

“A lot of times we think of a book as set in stone,” Glass said. “But a project like this shows you it’s messy. There’s a lot of variance to it.”

“When you pick up a book it’s important to know what copy it is, because that can affect the way you think about the story,” Glass said.

Just getting the texts into a form that a computer could process proved half the battle, said undergraduate team member Orgil Batzaya, a Duke double major in math and computer science.

The books were already scanned and posted online, so the students used software to download the scans from the internet, via a process called “scraping.” But processing the scanned pages of old printed books, some of which had smudges, specks or worn type, and converting them to a machine-readable format proved trickier than they thought.

The software struggled to decode the strange spellings (“deliver’d,” “wish’d,” “perswasions,” “shore” versus “shoar”), different typefaces between editions, and other quirks.

Special characters unique to 18th century fonts, such as the curious f-shaped version of the letter “s,” make even humans read “diftance” and “poffible” with a mental lisp.

Their first attempts came up with gobbledygook. “The resulting optical character recognition was completely unusable,” said team member and Duke senior Gabriel Guedes.

At a Data+ poster session in August, Guedes, Batzaya and history and computer science double major Lucian Li presented their initial results: a collection of colorful scatter plots, maps, flowcharts and line graphs.

Guedes pointed to clusters of dots on a network graph. “Here, the red editions are American, the blue editions are from the U.K.,” Guedes said. “The network graph recognizes the similarity between all these editions and clumps them together.”

Once they turned the scanned pages into machine-readable texts, the team fed them into a machine learning algorithm that measures the similarity between documents.

The algorithm takes in chunks of texts — sentences, paragraphs, even entire novels — and converts them to high-dimensional vectors.

Creating this numeric representation of each book, Guedes said, made it possible to perform mathematical operations on them. They added up the vectors for each book to find their sum, calculated the mean, and looked to see which edition was closest to the “average” edition. It turned out to be a version of Robinson Crusoe published in Glasgow in 1875.

They also analyzed the importance of specific plot points in determining a given edition’s closeness to the “average” edition: what about the moment when Crusoe spots a footprint in the sand and realizes that he’s not alone? Or the time when Crusoe and Friday, after leaving the island, battle hungry wolves in the Pyrenees?

The team’s results might be jarring to those unaccustomed to seeing 300 years of publishing reduced to a bar chart. But by using computers to compare thousands of books at a time, “digital humanities” scholars say it’s possible to trace large-scale patterns and trends that humans poring over individual books can’t.

“This is really something only a computer can do,” Guedes said, pointing to a time-lapse map showing how the Crusoe story spread across the globe, built from data on the place and date of publication for 15,000 editions.

“It’s a form of ‘distant reading’,” Guedes said. “You use this massive amount of information to help draw conclusions about publication history, the movement of ideas, and knowledge in general across time.”

This project was organized in collaboration with Charlotte Sussman (English) and Astrid Giugni (English, ISS). Check out the team’s results at https://orgilbatzaya.github.io/pirating-texts-site/

Data+ is sponsored by Bass Connections, the Information Initiative at Duke, the Social Science Research Institute, the departments of Mathematics and Statistical Science and MEDx. This project team was also supported by the Duke Office of Information Technology.

Other Duke sponsors include DTECH, Duke Health, Sanford School of Public Policy, Nicholas School of the Environment, Development and Alumni Affairs, Energy Initiative, Franklin Humanities Institute, Duke Forge, Duke Clinical Research, Office for Information Technology and the Office of the Provost, as well as the departments of Electrical & Computer Engineering, Computer Science, Biomedical Engineering, Biostatistics & Bioinformatics and Biology.

Government funding comes from the National Science Foundation.

Outside funding comes from Lenovo, Power for All and SAS.

Community partnerships, data and interesting problems come from the Durham Police and Sheriff’s Department, Glenn Elementary PTA, and the City of Durham.

Videos by Paschalia Nsato and Julian Santos; writing by Robin Smith

Can’t Decide What Clubs to Join Outside of Class? There’s a Web App for That

With 400-plus student organizations to choose from, Duke has more co-curriculars than you could ever hope to take advantage of in one college career. Navigating the sheer number of options can be overwhelming. So how do you go about finding your niche on campus?

Now there’s a Web app for that: the Duke CoCurricular Eadvisor. With just a few clicks it comes up with a personalized ranked list of student clubs and programs based on your interests and past participation compared to others.

“We want it to be like the activity fair, but online,” said  Duke computer science major Dezmanique Martin, who was part of a team of Duke undergrads in the Data+ summer research program who developed the “recommendation engine.”

“The goal is to make a web app that recommends activities like Netflix recommends movies,” said team member Alec Ashforth.

The project is still in the testing stage, but you can try it out for yourself, or add your student organization to the database, at https://eadvisorduke.shinyapps.io/login/

A “co-curricular” can be just about any learning experience that takes place outside of class and doesn’t count for credit, be it a student magazine, Science Olympiad or community service. Research shows that students who get involved on campus are more likely to graduate and thrive in the workplace post-graduation.

For the pilot version, the team compiled a list of more than 150 student programs related to technology. Each program was tagged with certain attributes.

Students start by entering a Net ID, major, and expected graduation date. Then they enter all the programs they have participated in at Duke so far, submit their profile, and hit “recommend.”

The e-advisor algorithm generates a ranked list of activities recommended just for the user.

The e-advisor might recognize that a student who did DataFest and HackDuke in their first two years likes computer science, research, technology and competitions. Based on that, the Duke Robotics Club might be highly recommended, while the Refugee Health Initiative would be ranked lower.

A new student can just indicate general interests by selecting a set of keywords from a drop-down menu. Whether it’s literature and humanities, creativity, competition, or research opportunities, the student and her advisor won’t have to puzzle over the options — the e-advisor does it for them.

The tool comes up with its recommendations using a combination of approaches. One, called content-based filtering, finds activities you might like based on what you’ve done in the past. The other, collaborative filtering, looks for other students with similar histories and tastes, and recommends activities they tried.

This could be a useful tool for advisors, too, noted Vice Provost for Interdisciplinary Studies Edward Balleisen, while learning about the EAdvisor team at this year’s Data+ Poster Session.

“With sole reliance on the app, there could be a danger of some students sticking with well-trodden paths, at the expense of going outside their comfort zone or trying new things,” Balleisen said.

But thinking through app recommendations along with a knowledgeable advisor “might lead to more focused discussions, greater awareness about options, and better decision-making,” he said.

Led by statistics Ph.D. candidate Lindsay Berry, so far the team has collected data from more than 80 students. Moving forward they’d like to add more co-curriculars to the database, and incorporate more features, such as an upvote/downvote system.

“It will be important for the app to include inputs about whether students had positive, neutral, or negative experiences with extra-curricular activities,” Balleisen added.

The system also doesn’t take into account a student’s level of engagement. “If you put Duke machine learning, we don’t know if you’re president of the club, or just a member who goes to events once a year,” said team member Vincent Liu, a rising sophomore majoring in computer science and statistics.

Ultimately, the hope is to “make it a viable product so we can give it to freshmen who don’t really want to know what they want to do, or even sophomores or juniors who are looking for new things,” said Brooke Keene, rising junior majoring in computer science and electrical and computer engineering.

Video by Paschalia Nsato and Julian Santos; writing by Robin Smith

Data+ is sponsored by Bass Connections, the Information Initiative at Duke, the Social Science Research Institute, the departments of Mathematics and Statistical Science and MEDx. This project team was also supported by the Duke Office of Information Technology.

Other Duke sponsors include DTECH, Duke Health, Sanford School of Public Policy, Nicholas School of the Environment, Development and Alumni Affairs, Energy Initiative, Franklin Humanities Institute, Duke Forge, Duke Clinical Research, Office for Information Technology and the Office of the Provost, as well as the departments of Electrical & Computer Engineering, Computer Science, Biomedical Engineering, Biostatistics & Bioinformatics and Biology.

Government funding comes from the National Science Foundation.

Outside funding comes from Lenovo, Power for All and SAS.

Community partnerships, data and interesting problems come from the Durham Police and Sheriff’s Department, Glenn Elementary PTA, and the City of Durham.

Page 18 of 42

Powered by WordPress & Theme by Anders Norén