
Reading 1,400-plus editions of “Robinson Crusoe” in one summer is impossible. So one team of students tried to train computers to do it for them.
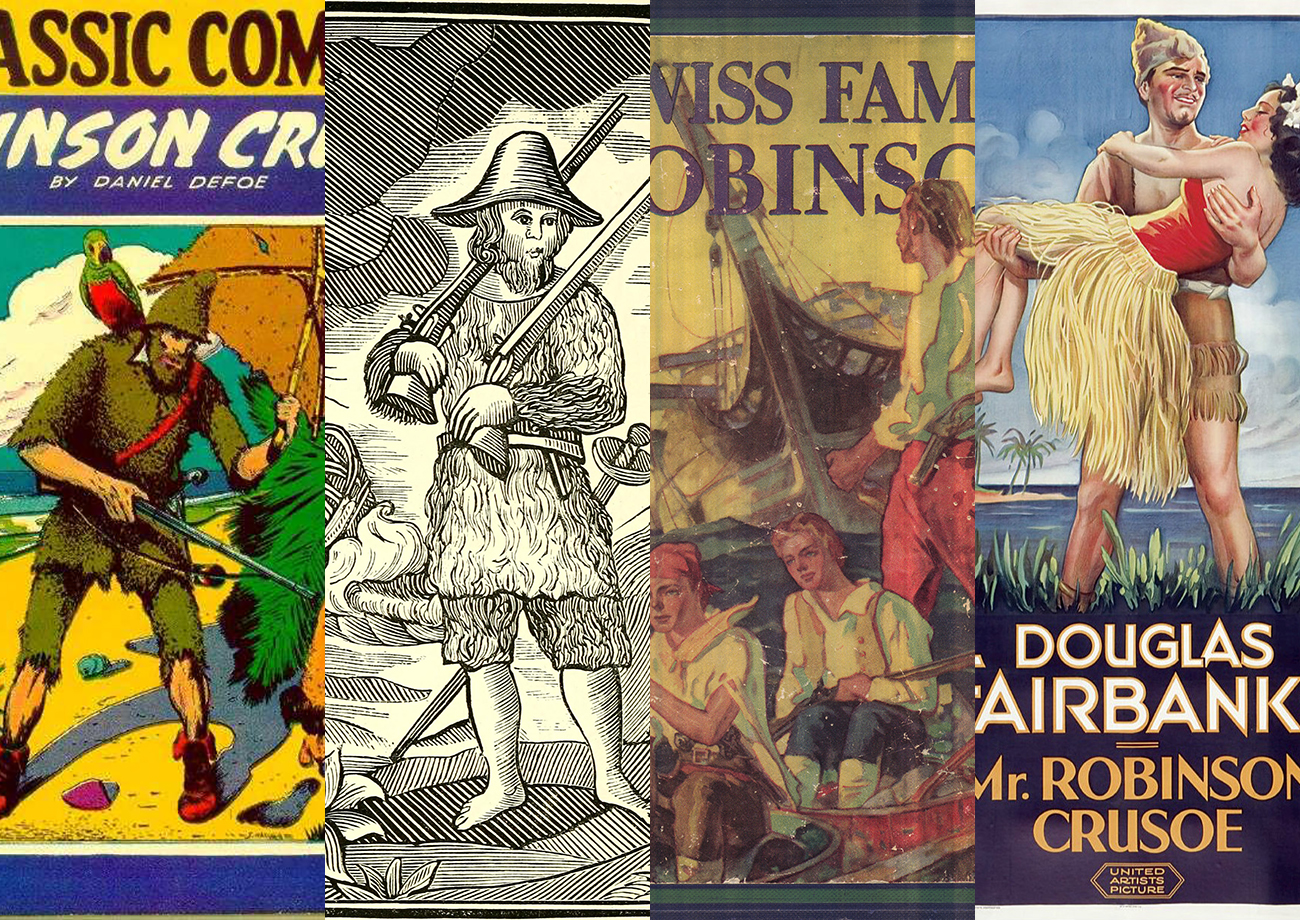
Since Daniel Defoe’s shipwreck tale “Robinson Crusoe” was first published nearly 300 years ago, thousands of editions and spinoff versions have been published, in hundreds of languages.
A research team led by Grant Glass, a Ph.D. student in English and comparative literature at the University of North Carolina at Chapel Hill, wanted to know how the story changed as it went through various editions, imitations and translations, and to see which parts stood the test of time.
Reading through them all at a pace of one a day would take years. Instead, the researchers are training computers to do it for them.
This summer, Glass’ team in the Data+ summer research program used computer algorithms and machine learning techniques to sift through 1,482 full-text versions of Robinson Crusoe, compiled from online archives.
“A lot of times we think of a book as set in stone,” Glass said. “But a project like this shows you it’s messy. There’s a lot of variance to it.”
“When you pick up a book it’s important to know what copy it is, because that can affect the way you think about the story,” Glass said.
Just getting the texts into a form that a computer could process proved half the battle, said undergraduate team member Orgil Batzaya, a Duke double major in math and computer science.
The books were already scanned and posted online, so the students used software to download the scans from the internet, via a process called “scraping.” But processing the scanned pages of old printed books, some of which had smudges, specks or worn type, and converting them to a machine-readable format proved trickier than they thought.
The software struggled to decode the strange spellings (“deliver’d,” “wish’d,” “perswasions,” “shore” versus “shoar”), different typefaces between editions, and other quirks.
Special characters unique to 18th century fonts, such as the curious f-shaped version of the letter “s,” make even humans read “diftance” and “poffible” with a mental lisp.
Their first attempts came up with gobbledygook. “The resulting optical character recognition was completely unusable,” said team member and Duke senior Gabriel Guedes.
At a Data+ poster session in August, Guedes, Batzaya and history and computer science double major Lucian Li presented their initial results: a collection of colorful scatter plots, maps, flowcharts and line graphs.
Guedes pointed to clusters of dots on a network graph. “Here, the red editions are American, the blue editions are from the U.K.,” Guedes said. “The network graph recognizes the similarity between all these editions and clumps them together.”
Once they turned the scanned pages into machine-readable texts, the team fed them into a machine learning algorithm that measures the similarity between documents.
The algorithm takes in chunks of texts — sentences, paragraphs, even entire novels — and converts them to high-dimensional vectors.
Creating this numeric representation of each book, Guedes said, made it possible to perform mathematical operations on them. They added up the vectors for each book to find their sum, calculated the mean, and looked to see which edition was closest to the “average” edition. It turned out to be a version of Robinson Crusoe published in Glasgow in 1875.
They also analyzed the importance of specific plot points in determining a given edition’s closeness to the “average” edition: what about the moment when Crusoe spots a footprint in the sand and realizes that he’s not alone? Or the time when Crusoe and Friday, after leaving the island, battle hungry wolves in the Pyrenees?
The team’s results might be jarring to those unaccustomed to seeing 300 years of publishing reduced to a bar chart. But by using computers to compare thousands of books at a time, “digital humanities” scholars say it’s possible to trace large-scale patterns and trends that humans poring over individual books can’t.
“This is really something only a computer can do,” Guedes said, pointing to a time-lapse map showing how the Crusoe story spread across the globe, built from data on the place and date of publication for 15,000 editions.
“It’s a form of ‘distant reading’,” Guedes said. “You use this massive amount of information to help draw conclusions about publication history, the movement of ideas, and knowledge in general across time.”
This project was organized in collaboration with Charlotte Sussman (English) and Astrid Giugni (English, ISS). Check out the team’s results at https://orgilbatzaya.github.io/pirating-texts-site/
Data+ is sponsored by Bass Connections, the Information Initiative at Duke, the Social Science Research Institute, the departments of Mathematics and Statistical Science and MEDx. This project team was also supported by the Duke Office of Information Technology.
Other Duke sponsors include DTECH, Duke Health, Sanford School of Public Policy, Nicholas School of the Environment, Development and Alumni Affairs, Energy Initiative, Franklin Humanities Institute, Duke Forge, Duke Clinical Research, Office for Information Technology and the Office of the Provost, as well as the departments of Electrical & Computer Engineering, Computer Science, Biomedical Engineering, Biostatistics & Bioinformatics and Biology.
Government funding comes from the National Science Foundation.
Outside funding comes from Lenovo, Power for All and SAS.
Community partnerships, data and interesting problems come from the Durham Police and Sheriff’s Department, Glenn Elementary PTA, and the City of Durham.

Videos by Paschalia Nsato and Julian Santos; writing by Robin Smith