Following the people and events that make up the research community at Duke

Students exploring the Innovation Co-Lab

Category: Computers/Technology Page 16 of 20

Origami-Inspired Chemistry Textbook Brings Molecules To Life

by Anika Radiya-Dixit

Your college textbook pages probably look something like the picture below – traffic jams of black boats on a prosaic white sea.

blackAndWhiteText

Textbook without illustrations.

But instead of reading purely from static texts, what if your chemistry class had 3D touch-screens that allowed you to manipulate the colors and positions of atoms to give you visual sense of how crystal and organic structures align with respect to each other? Or what if you could fold pieces of paper into different shapes to represent various combinations of protein structures? This is the future of science: visualization.

Duke students and staff gathered in the Levine Science Research Center last week to learn more about visualizing chemical compounds while munching on their chili and salad. Robert Hanson, Professor in the Department of Chemistry at St. Olaf College, was enthusiastic to present his research on new ways to visualize and understand experimental data.

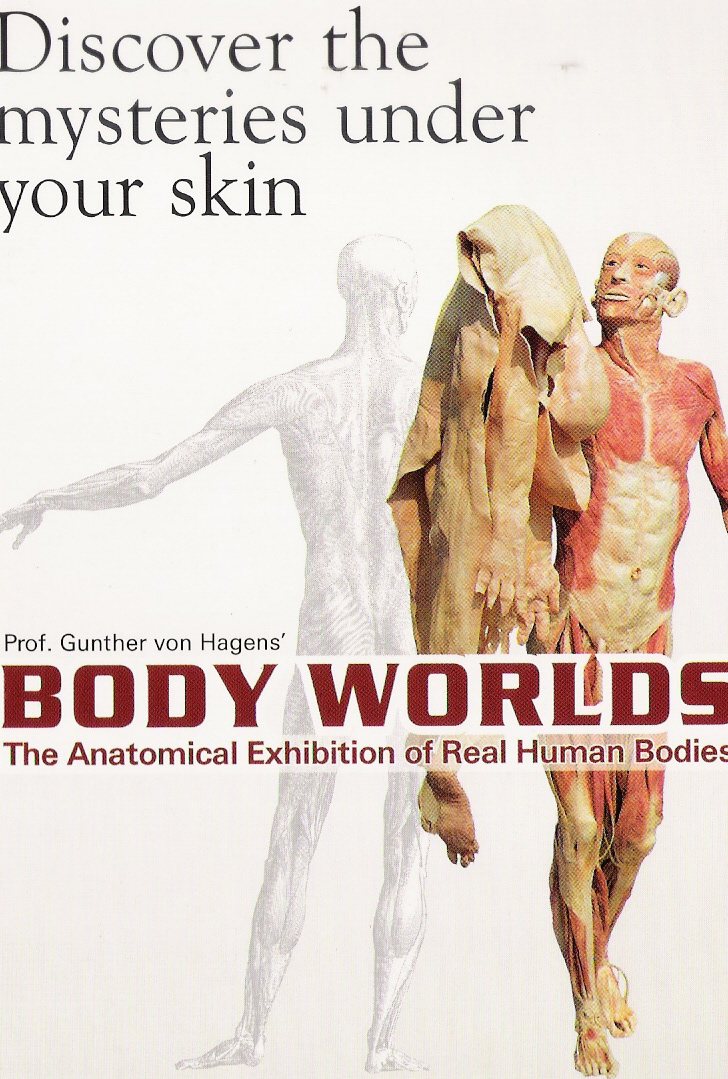
Exhibition poster of “Body Worlds”


Hanson opened his talk with various applications of visualization in research. He expressed a huge respect for medical visualization and the people who are able to illustrate medical procedures, because “these artists are drawing what no one can see.” Take “Body Worlds,” for example, he said. One of the most renowned exhibitions displaying the artistic beauty of the human body, it elicited a myriad of reactions from the audience members, from mildly nauseated to animatedly pumped.

Hanson also spoke about the significance of having an effective visualization design. Very simple changes in visualization, such as a table of numbers versus a labeled graph, can make a “big difference in terms of ease of the audience catching on to what the data means.” For example, consider the excerpt of a textbook by J. Willard Gibbs below. One of the earliest chemists to study the relationship between pressure and temperature, Gibbs wrote “incredibly legible, detailed, verbatim notes,” Hanson said. Then he asked the audience: Honestly, would one read the text fervently, and if so, how easy would it be to understand these relationships?

Gibbs'Text

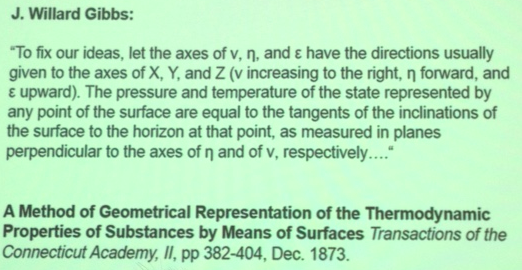
Excerpt of J. Gibbs’ text.

Not very, according to James C. Maxwell, a distinguished mathematician and physicist, who attempted to design a simpler mechanism with his inverted 3D plaster model.

Maxwell'sPlaster

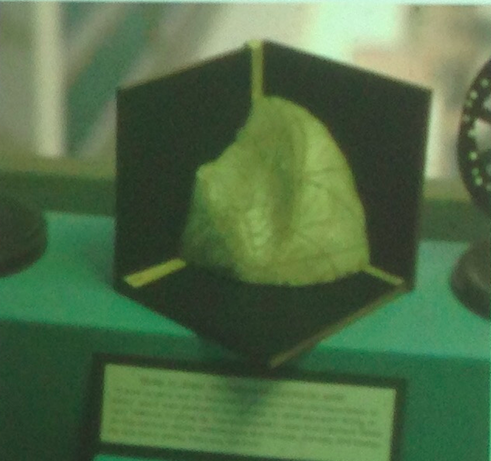
Maxwell’s plaster model of Gibbs’ surface

Subsequent scientists created the graph shown below to represent the relationships. Compared to the text, the diagram gives several different pieces of information about entropy and temperature and pressure that allow the reader to “simply observe and trace the graph to find various points of equilibrium that they couldn’t immediately understand” from a block of black and white text.

Graph

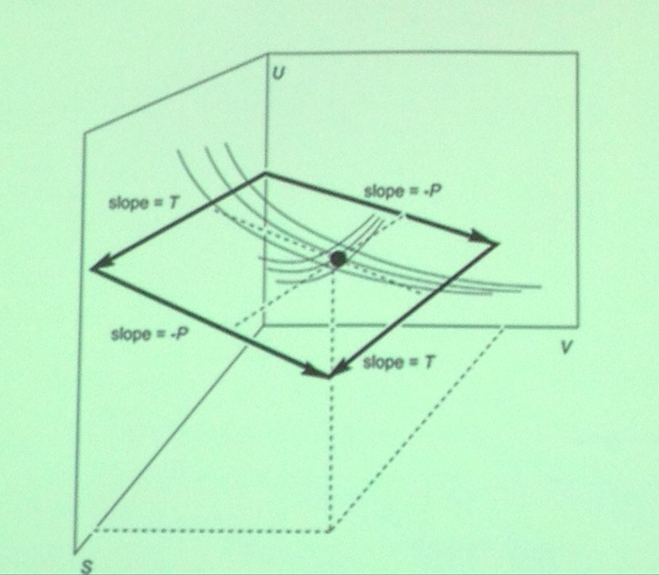
Graphical view of Gibbs’ theory on the relation between temperature and pressure.

Hanson went further in his passion to bring chemistry to the physical realm in his book titled “Molecular Origami.” The reader photocopies or tears out a page from the book, and then folds up the piece of paper according to dotted guidelines in order to form origami molecular “ornaments.” The structures are marked with important pieces of information that allow students to observe and appreciate the symmetry and shapes of the various parts of the molecule.

origami

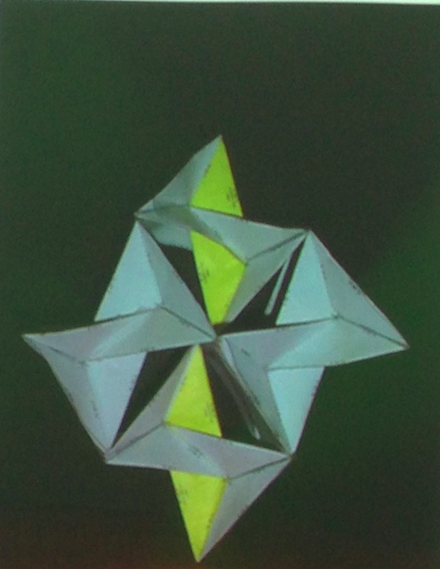
3D origami model of marcasite (scale: 200 million : 1)


One of his best moments with his work, Hanson recounted, was when he received a telephone call from some students in a high school asking him for directions on how to put together a 3D model of bone. After two hours of guiding the students, he asked the students what the model finally looked like – since he had knowledge of only the chemical components – and was amused to hear a cheeky “He doesn’t know.” Later that year, Hanson was rewarded to see the beautiful physical model displayed in a museum, and was overjoyed when he learned that his book was the inspiration for the students’ project.

More recently, Hanson has worked on developing virtual software to view compounds in 3D complete with perspective scrolling. One of his computer visualizations is located in the “Take a Nanooze Break” exhibition in Disneyland, and allows the user to manipulate the color and location of atoms to explore various possible compounds.

TouchAMolecule

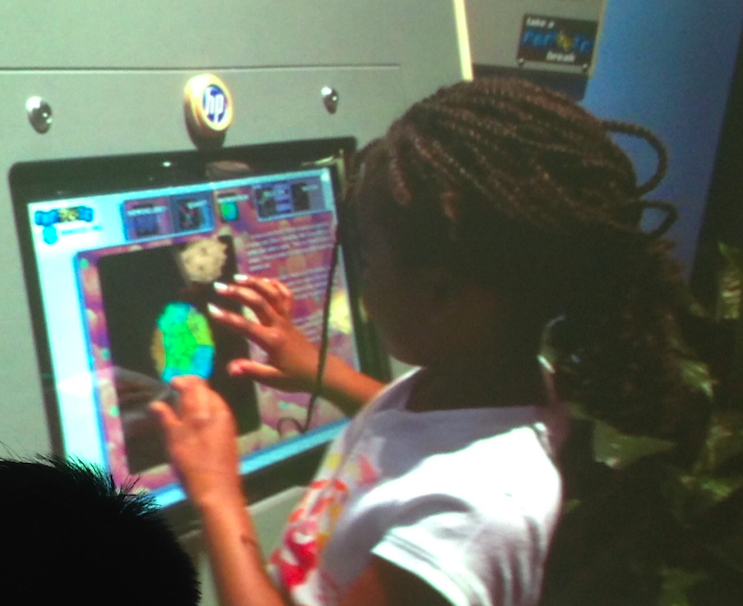
“Touch-A-Molecule” is located in the Epcot Center in Disneyland.

By creating images and interactive software for chemical compounds, Hanson believes that good visualization can empower educators to gain new insights and make new discoveries at the atomic level. By experimenting with new techniques for dynamic imagery, Hanson pushes not only the “boundaries of visualization,” but more importantly, the “boundaries of science” itself.

Hanson

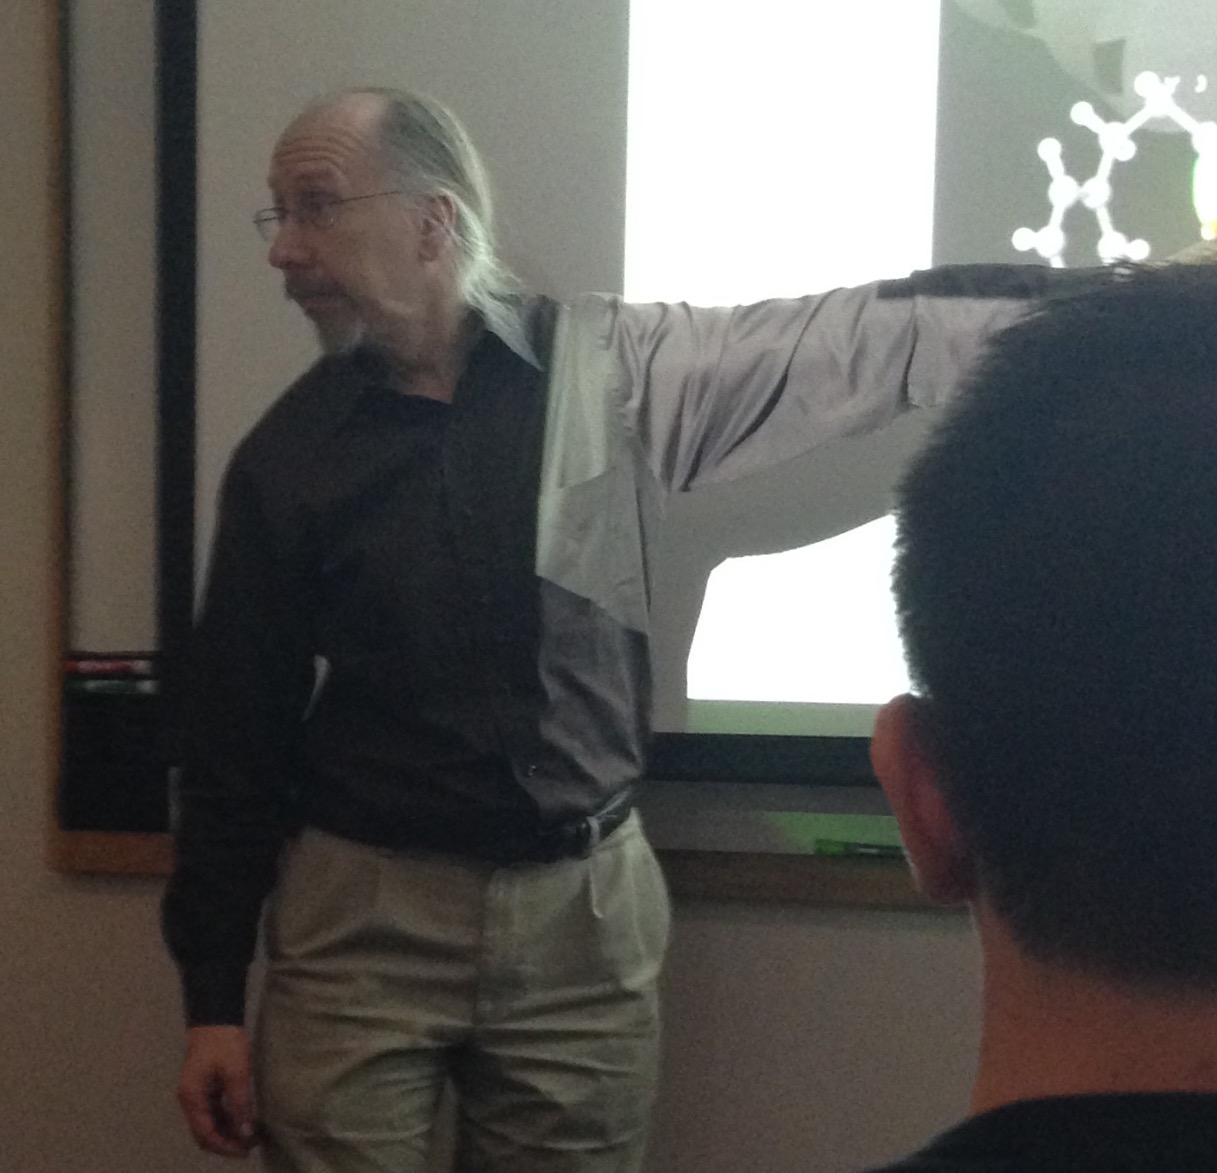
Professor Hanson explains how to visualize points of interaction on a molecule.


Contact Professor Hanson at hansonr@stolaf.edu

Read more about the event details here.

View Hanson’s book on “Molecular Origami” or buy a copy from Amazon.

iGEM: An Exciting Way to Merge Biology and Engineering

Screen Shot 2015-01-12 at 6.41.06 PM

Duke iGEM 2014 team with faculty advisors Nick Buchler, front left, and Charlie Gersbach, front right. Mike is behind Dr. Gersbach.

by Anika Radiya-Dixit

The International Genetically Engineered Machine (iGEM) competition is dedicated to education for students interested in the advancement of synthetic biology, in other words, taking engineering principles and applying them to natural sciences like biology.

Students in the competition explored using a gene or series of genes from E.coli bacteria to create biological devices for applications such as dissolving plastic or filtering water. In November 2014, the Duke iGEM team took part in the annual competition in Boston, proudly leaving with a gold medal on their work in 3D printing technology and DNA synthesis protocol.

This week, I contacted the iGEM team and had the opportunity to talk with one of the members, Mike Zhu, about his experience in the competition. Mike is currently a junior from Northern California studying Biomedical Engineering and Computer Science. He is enthusiastic about researching how biology and computer science interact, and is conducting research with Dr. John Reif on DNA technology. Mike is also involved with the Chinese Dance team, and enjoys cooking, eating, and sleeping. Below is an edited transcript of the interview.


How did you get interested in your project topic?

We wanted to build a binary response platform that uses logic gates or on-off switches in E. coli to make it easier to regulate genes. We used the CRISPr/Cas9 system that allows for specific targeting of any gene, and that enables synthetic biologists to create more complex gene circuits. Personally, I was interested in developing an infrastructure that allows engineering concepts to be applied to cells, such as creating code that allows cells to do arithmetic so they can keep track of the cells around them. I think applications like these open doors to a really cool field.


What was your best moment during the Boston competition?

The competition was four days long, but we had to come back early due to work and midterms, so we missed the last dance and dinner, but overall it was a lot of fun. There were multiple workshops and talks, and the one that stood out most to me was one by someone from MIT who designed a ‘biocompiler’ to take code specifying the behavior of cells [1]. It was essentially like creating a programming language for cells, and I thought that was really cool.

Tell me about someone interesting you met.

There were a lot of people from the industry who came by and asked about our project, and some of them wanted to recruit us for internships. At the competition, there were people from all over the world, and I liked best that they were friendly and genuinely interested in developing tools to work with cells.


Experiment work in a biology lab.

What was the hardest or most frustrating part of working on the project?

Lab work is always the most frustrating because you’re dealing with microscopic parts – things easily go wrong and it’s difficult to debug, so we ended up repeating the experiments over and over to work through it.

 Are you continuing with  the competition this year?

I’m working for Caribou Biosciences in Berkeley, one of the companies that wanted to recruit us during the competition. They are developing tech similar to what we did, so I enjoy that.

It’s a good thing to get into bioengineering. People are trying to make  tech cheaper and easier so we can potentially do experiments in our garage – sort of like ‘biohacking’ or do-it-yourself-biology – and this still has a long way to go, but it’s really cool.

MikeZhu

Mike Zhu, wearing the competition shirt.

Now that you’ve gone through the competition, what would you like to say to future students who are interested in applying their knowledge of BME  learned at Duke?

There are a lot of clubs at Duke that are project-based, but these are primarily in Electrical Engineering or Mechanical Engineering, so the iGEM competition is – as far as I know – the only project-based club for students more interested in biology. You get funding, lab space, and mentors with a team of undergraduates who can work on a project themselves. It’s pretty rare for both PIs [Principal Investigators] to give the undergrads free reign to work on what they want, especially compared to volunteering in a lab. You also get a chance to present your project and meet up with other people, and you’re exposed to topics most students get to experience only in senior year classes. Overall, the club is a great way to be introduced to cutting edge research, and it’s a good opportunity for freshman to find out what’s going on in BME.

Learn More about the Duke iGEM team and project

[1] More about MIT’s Biocomplier can be read at http://web.mit.edu/jakebeal/www/Talks/IBE12-BioCompiler-Feedback-abstract.txt.


Multidimensional Student Maps Multidimensional Data

Grad Student Chris Trailie is a very three-dimensional person.

Grad Student Chris Tralie is a multi-dimensional person.

Guest post by Aravind Ezhilarasan, NC School of Science and Math

As I walked up to Gross Hall at Duke University, I felt nervous with butterflies in my stomach and honored to be able to interview Chris Tralie, a  mathematician, computer scientist, musician, and music enthusiast. My hands were getting clammy, I was starting to have second thoughts about doing the interview, and I was shivering, not because of the chilly winter weather, but rather due to the contradicting feeling of giddy, childish excitement that was racing through me.

I had looked into his research, but had trouble making sense of it and was extremely puzzled as to how someone went from computer science to electrical engineering to mathematics.

With all this on my mind, I walked up the steps of Gross Hall.

Tralie, a doctoral candidate in Duke’s Electrical and Computer Engineering department, met me at the front door and led me up to a conference room where I asked him my first question: “Could you explain your research to me, a high school senior?” He hesitated a second, then jumped into the best lecture of my life.

Chris Tralie

Chris Tralie in the visible spectrum.

Tralie is currently working on the use of a simple geometric concept, loops, to identify and label songs by genre. He explained that he takes a song and tracks the loops in the song: intro, verse, chorus, then back to the verse (one loop), then back to the chorus, then back to the verse (two loops), etc.

He then takes the raw data he gets and turn it into a diagram. He explained that he maps the raw data out in a multidimensional environment, which has twelve dimensions to represent each note in a scale and more than forty other dimensions to represent different instrumentation in a song. It is impossible to visualize any object that has more dimensions than the three that we are acclimated to so Tralie then translates this multidimensional curve into three dimensions. You can check out the final product of this process for any song on his website, loopditty.net .

At this point of our exchange, my mind was well past blown.

Noticing my shocked, surprised, and ecstatic expression, he chuckled. I explained to him that I love what he is doing with this simple concept, but am still lost as to how one translates a multidimensional or high dimensional object into something three dimensional and perceivable. He then stepped back and explained this amazing process.

According to Tralie, when a light is far enough from an object, its rays are so close to being parallel that they are just taken to be parallel. When you shine this far-off light on a three-dimensional object, you get an analyzable two- dimensional object. In this same way, Tralie plays the role of the light for each extra dimension in his high dimensional models so he can simplify it down to a analyzable three dimensional object.

I asked him about his life and what made him switch from electrical engineering to computer science to a combination of computer science and mathematics. He then flashed back to his time as a kid. He explained that his goal in life as a young boy was to make video games. He always wanted to be the man behind the countless hours of entertainment he enjoyed. To reach this goal, he went into computer science and slowly realized electrical engineering was also a big player in reaching this goal. Through these experiences he went from computer science to electrical engineering. From there he went to a couple of transitional projects and eventually ended up at Duke University where he took on his long-lost hobby of mathematics and with the inspiration from his music appreciation days in his college eating club, he took on the genre labeling project.

Aravind Ezhilarasan

Aravind Ezhilarasan

Finally, I asked him where he wanted his brainchild to be in the next three to five years. He explained that his genre labeling project is only the first step. He plans to take the looping concept that drives the project and apply it to many other scenarios. The point of his genre labeling project is to help him fully understand this concept and to work out all the possible problems that can occur. Eventually, he plans on using it in situations like security where instead of tracking loops in songs, it will track loops in security footage (someone walking on and then off the screen would be one loop).

As I left that building and made the trip back to the North Carolina School of Science and Mathematics, I felt content. I had walked into that building anxiously, feeling small and wondering what my interviewee would think of me when he realized I knew very little about his research and how someone switched between so many fields of science.

I walked out feeling well informed, understanding the transition in one’s thoughts and interests throughout the path of life, and with a new friend.

Passion, Modeling and Viruses are all Cool

Guest Post By Jaye Sudweeks, NC School of Science and Math

corona viruses

Corona viruses like SARS (CDC image)

Viruses are very cool.  Ashley Sobel taught me that.

Sobel is an MD/PHD student at Duke.  She currently works in the Koelle Research Group, a group that focuses on using mathematical models to understand the “ecological and evolutionary dynamics of infectious diseases.”

When I asked Ashley what in particular drew her to infectious diseases, she had a ready answer. “Infectious diseases are pretty awesome.  They have shaped more of human civilization than anything else. It’s very clear that the reason some wars came out the way they did isn’t because of good generals or good supply lines, but because of the viruses, pathogens and bacteria that people brought with them.”

Ashley Sobel is being groomed to be a physician-scientist.

Ashley Sobel is being groomed to be a physician-scientist.

Ashley’s interest in infectious diseases was piqued in high school, when the SARS virus hit. She recalls being intrigued that such a new phenomenon could have such a major impact.

It was this interest in SARS, along with participating in science Olympiad that drew Ashley to science. Ashley’s involvement in Science Olympiad began when the instructor found out that she was building her own cello out of a mannequin. “It’s name was Wilberta,” Ashley remembers fondly. “We gave it a coconut bra and a hula skirt.”

As a scientist, Ashley considers mathematics and modeling interesting tools to investigate infectious disease. “Modeling is basically taking key relationships that we know are true and putting them together in a mathematical context to see what we can learn about the underlying processes. You identify processes that you might not get by looking at the data.”

Ashley shared with me the process of building a model. The first thing to do when building a model, she explains, is to gain an understanding of the biology affecting the scenario. This should be followed by an examination of pre-existing models.

Next, it is important to make simplifications that allow your model to function, but don’t trivialize the subject matter. “There are a lot of standard assumptions,” she explains.

The time it takes to construct a model varies. Ashley has only recently completed a project that she started two years ago.  “It can take a long time to identify the mathematics that will give you the patterns that you see in nature.”

Jaye Sudweeks

Jaye Sudweeks

As a scientist, Ashley values the emphasis that the scientific community places on curiosity, a trait that she feels is looked down upon in other career fields. And, after just one conversation with Ashley, it is easy to see why she feels that way. Ashley is easily one of the most curious, passionate, and inspiring people I have ever had the privilege to meet.  In the span of our brief meeting, Ashley sat crossed legged in her spinning office chair and taught me a couple of very important things.

Passion is cool. Modeling is cool. Viruses are cool.

Touring Duke's Biggest Laboratory

Sari Palmroth

Sari Palmroth and the 130-foot research tower in the Blackwood Division of Duke Forest.

By Karl Leif Bates

You may think of Duke Forest as a nice place to run or walk your dog, but it’s actually the largest research laboratory on campus, and probably the oldest too.

Last week, Duke Forest director Sara Childs and operations manager Jenna Schreiber took about a dozen interested stakeholders on a whirlwind tour to see three active research installations tucked away in areas of Duke Forest the public often doesn’t see.


We had to hunt a little to find UNC Biology grad student Jes Coyle in the Korstian division off Whitfield Road, but at least she wasn’t 30 feet up in an oak tree like she usually is. Jes showed the group some of her cool climbing gear while explaining her work on figuring out which part of a lichen, the fungus or the algae, is more responsible for the lichen’s adaptation to microclimates.

She does this by climbing way the heck up into trees to affix little data loggers that track temperature and sunlight at various places on the trunk.

Coyle is looking at 67 lichen species in 54 sampling locations, which is a lot of climbing and a lot of little $50 loggers.

The whole time Jes was talking, we were eyeing her six-foot-tall slingshot and waiting for it to come into play.

Jes Coyle

UNC grad student Jes Coyle shows off her climbing gear.

Indeed it did, as she let three participants, including Sara Childs, have a go at shooting a ball on a fine string over a likely-looking branch to start a climbing rope. (None succeeded.)


Abundant data was the theme at our second stop too, where Sari Palmroth, an associate research professor in the Nicholas School of the Environment, explained how she measures how much water goes into and out of a tree.  Her installation is in the Blackwood Division off Eubanks Road, tucked behind the old FACE experiment.

Standing next to an imposing 130-foot scaffolding tower studded with active and abandoned instruments of all sorts, Palmroth said a square meter of Duke Forest exhales about 700 mm of rainfall a year, which is about half of what falls on it. “How do I know these numbers? Because it’s my job.”

In addition to being a lovely place to get away from the world and sway with the treetops, the tower measures CO2 levels at different heights throughout the canopy.

Sari Palmroth

Palmroth reveals where probes go into a tree trunk.

The tower also hosts a big white box stuffed with wires that capture data streaming in from sensors embedded in the tree trunks all around the tower.

Palmroth and her colleagues are seeing the trees breathe. During the day, when the tiny pores on the underside of their leaves – called stomata — are open and exhaling water and oxygen, roots in the top 40 centimeters of soil are pulling in more water. When the sun sets and the stomata close, then the tree’s deeper roots pull water up to the top level for tomorrow’s drinking.  Unless it doesn’t get cool at night and the stomata don’t completely close, which is the prediction for some climate change scenarios. What then?


Aaron Berdanier

Back in the vans and even deeper into the Blackwood division, we come upon an intrepid young man in a flannel shirt sitting in a sunny spot by the side of the two-track. He’s Aaron Berdanier, a doctoral candidate at Duke who is also looking at water use by taking  automated measurements of 75 trees every minute for four straight years.

His work is part of a larger research project established by Nicholas School professor Jim Clark 15 years ago. Every one of the 14,000 trees in this sloping 20-acre stand of the forest — from spindly saplings to giants —  is labeled and has its data regularly collected by a platoon of undergrads armed with computer tablets.

Other data flows automatically on webs of wiring leading to data loggers situated every few yards. Some of the trees wear a stainless steel collar with a spring that measures their circumference constantly and precisely. They change noticeably both seasonally and by the year, Berdanier says.

The forest is alive and its trees are breathing and pulsing. Berdanier likens his detailed measurement of water consumption to taking a human patient’s pulse. “We’re trying to determine winners and losers under future climate conditions.”

Duke Forest Q&A

Aaron handled a wide-ranging Q&A with the curious visitors as the sun set and the temperature fell.

Why Airport Scanners Catch the Water Bottle but Miss the Dynamite

Guest post by Caroline Drucker

A screenshot of the Airport Scanner game, with a suitcase containing two dynamite sticks. Courtesy of the Mitroff Lab and the Kedlin Company.

A screenshot of the Airport Scanner game, with a suitcase containing two dynamite sticks. Courtesy of the Mitroff Lab and the Kedlin Company.

You’re at the airport waiting to pass through security and board your flight. The security agent stops the person in line ahead of you: there was a full water bottle in his carry-on bag. He throws out the bottle and proceeds through the airport. Later that evening, you see that person’s face on the news, for having pulled out dynamite on their flight. Why did the TSA agent overlook the dynamite?

A team of researchers at Duke led by Dr. Stephen Mitroff is using a cell phone game to provide answers to this and other questions about airport baggage screenings. Last year, they reported that luggage screeners are likely to miss extremely rare illegal items. In a new study which will appear in the Journal of Experimental Psychology: Human Perception and Performance, Dr. Mitroff’s team once again leverages the power of big data to address a different issue: what happens when a carry-on suitcase contains multiple illicit items?

Baggage screening is an example of what cognitive scientists refer to as visual search: attempting to locate a target among a crowded visual display. Many laboratory studies have demonstrated that when more than one target is present in the display, people are less likely to find additional targets once they have spotted a first target. One possible reason for this “subsequent search misses” phenomenon is that people become biased toward searching for targets that match the first target. That is, a baggage screener who finds a water bottle might enter “water bottle” mode and be unprepared to see dynamite. This theory is most likely to hold in situations with large and unpredictable sets of targets – which is precisely why it has been difficult to test in the lab, where the relatively small amount of trials that subjects can perform has limited the possible target numbers and frequencies.

A smartphone game called Airport Scanner circumvents this problem. In the game, players act as TSA agents and view X-ray images of carry-on luggage, earning points for correctly tapping illegal items. More than 200 possible illegal items can appear, and each bag can contain between zero and three illegal items among up to twenty legal items. The game is available as a free download from the Kedlin Company, who share the data with the Mitroff lab. They have now collected close to two billion trials (bags searched) from over seven million people, which would take centuries to collect in the lab.

Using these data, Dr. Mitroff and his colleagues were able to make an important discovery about subsequent search misses. When two identical targets are present in a bag, it is more likely that both will be found than when two different targets are present. In other words, if someone first spots a water bottle, it is more likely that they will also find a second item if it is a water bottle than if it is dynamite.

This result supports the theory that finding a visual target biases a person’s perceptions. We become better prepared to find another instance of the same item, rather than a different item. According to Dr. Mitroff, “Knowing this fact can help create search environments and standard operating procedures to overcome this priming effect.”

500+ Students Code Around The Clock For Social Causes

Tech lovers pull all-night codefest for social good, Nov. 15-16, 2014

More than 500 students converged on Duke’s Fitzpatrick Center for an unusual all-nighter this weekend. No term papers, no problem sets. Their mission: to collaborate on software or hardware projects related to social good. The students were participating in “HackDuke,” the third in a series of 24-hour hackathons held at Duke since 2013.

Read more in The Chronicle and The Herald-Sun.

Checking in at HackDuke: Code for Good

Hacking = Hack + Marathon

To some, “hacking” conjures up images of breaking into bank accounts. But these tech-savvy students are no cyber criminals. The event, dubbed “Code for Good,” challenged them to work in teams to propose tech solutions to problems in any one of four themes — poverty and inequality, health and wellness, education and energy and environment.h2

No experience? No problem

The hacking got rolling around 2 p.m. on Saturday, Nov. 15. Armed with laptops and Ethernet cables, the students fanned out across three floors of the Fitzpatrick Center atrium and got to work. First-time hackers and novice programmers were welcome. Roughly half of this year’s participants were from Duke, and half were from other universities across the United States and Canada. More than 20 percent of the participants were women.h3 h4 h5 h6

A caffeine- and sugar-fueled coding frenzy

The hackers worked non-stop for 24 hours, many with little sleep and no showers. Vast quantities of caffeine and sugar helped. Back by popular demand, after 10 p.m. the CIEMAS basement became a foam-filled battlefield for hackers in need of a nerf gun break:h7 h8 h9

h10 h11 h12

Day 2

Bleary-eyed hackers started presenting their solutions to the judges around 12:30 p.m. on Sunday. One team developed a cloud-based temperature sensor for monitoring premature newborns who are born at home and can’t make it to a clinic. Another team developed an app called “Ananda,” or bliss,which measures the relationship between a range of personal habits and a person’s self-reported happiness score. The winning team from each track received a $750 donation in their name to the nonprofit of their choice. Judge and IBM Program Director Ginny Ghezzo tweeted her favorites:h13 h14h15 h16 h17 h18

A Made-to-Order Materials Menu

Guest Post by Ken Kingery, Pratt School of Engineering

If you think ordering a drink from Starbucks can be a tall order, try picking out the right material for a new product or experiment. An iced, half-caff, four-pump, sugar-free, venti cinnamon dolce soy skinny latte may be a mouthful, but there are hundreds of thousands of known—and unknown—compounds to choose from, each with their own set of characteristics.

Screenshot of the AFLOW library search interface. The software combs through four giant databases of chemical compounds.

Screenshot of the AFLOW library search interface. The software combs through four giant databases of chemical compounds.

For example, take the family of materials Bi2Sr2Can-1CunO2n+4+x, or bismuth strontium calcium copper oxide for short, if you can call it that. These compounds have the potential to change the world because of their ability to become superconducting at relatively high temperatures. But each sibling, cousin or distant relative has its own physical variations…so how to choose which to pursue?

Thanks to Stefano Curtarolo and his research group, now there’s an app for that.
Curtarolo leads a collection of research groups from seven universities specializing in something they call materials genomics. The group—called the AFLOW consortium—uses supercomputers to comb databases for similar structures and builds theoretical models atom-by-atom to predict how they might behave.

With help from several members of the consortium, Pratt School of Engineering postdocs Cormac Toher, Jose Javier Plata Ramos and Frisco Rose, along with Duke student Harvey Shi, have spent the past few months building a system that combs through four materials databases. Users can choose the elements and characteristics they want a material to have—or not to have—and the website will play matchmaker.

Want a two-element compound containing either silicon or germanium—but not gallium—that is stable enough to withstand high temperatures? Not a problem. How about an electric insulator made from transition metals with a certain crystal structure? AFLOW has you covered.

Stefano Curtarolo

Stefano Curtarolo is a professor of mechanical engineering and materials science at Duke

One of the four databases searched by the program draws from an international collection of compounds with structures known from experimentation. The other three contain single- double- or triple-element compounds, and are not limited to previously explored materials. Through their molecule-building algorithms, the AFLOW consortium is constantly adding prospective materials to these four libraries.

The search engine currently can sort through more than 622,000 known and unknown compounds, and more than 1,000 new ones are added each week. Curtarolo, a professor of materials science and physics, hopes that the open-source program will continue to grow in materials and searchable characteristics to help scientists connect to their ideal material. To see how it works for yourself, take it for a test drive here.

As for an equivalent database of coffee drinks, that has yet to be built. So if you’re looking through AFLOW for a hot, lactose-free drink featuring 150 to 200 mg of caffeine and less than 200 calories made with beans from South America, you’re out of luck.

Fruit flies get their close-up shot, Nobel style

By Robin Ann Smith

Any movie that begins with an extreme close-up of the back side of a fruit fly — the same kind found feeding on over-ripe tomatoes and bananas in your kitchen — may seem like an unlikely candidate for action blockbuster of the year. But this is no typical movie.

https://www.youtube.com/watch?v=fwzIUnKNw0s

Duke biologists Dan Kiehart and Serdar Tulu recorded this 3D close-up of a developing fly embryo using new super-resolution microscope technology developed by Eric Betzig, one of the winners of the 2014 Nobel Prize in Chemistry.

Cutting-edge microscopes available on many campuses today allow researchers to take one or two images a second, but with a new technique called lattice light-sheet microscopy — developed by Betzig and colleagues and reported in the Oct. 24, 2014, issue of Science — researchers can take more than 50 images a second, and in the specimen’s natural state, without smooshing it under a cover slip.

Kiehart and Tulu traveled to the Howard Hughes Medical Institute’s Janelia Farm research campus in Ashburn, Virginia, where the new microscope is housed, to capture the early stages of a fruit fly’s development from egg to adult in 3D.

Fruit fly embryos are smaller than a grain of rice. By zooming in on an area of the fly embryo’s back that is about 80 microns long and 80 microns wide — a mere fraction of the size of the period at the end of this sentence — the researchers were able to watch a line of muscle-like cells draw together like a purse string to close a gap in the fly embryo’s back.

The process is a crucial step in the embryo’s development into a larva. It could help researchers better understand wound healing and spina bifida in humans.

Their movie was assembled from more than 250,000 2D images taken over 100 minutes. The hundreds of thousands of 2D snapshots were then transferred to a computer, which used image-processing software to assemble them into a 3D movie.

“This microscope gives us the highest combination of spatial and temporal resolution that we can get,” Kiehart said.

Betzig won this year’s Nobel Prize for his work on techniques that allow researchers to peer inside living cells and resolve structures smaller than 200 nanometers, or half the wavelength of light — a scale once thought impossible using traditional light microscopes.

Even finer atomic-scale resolution has long been possible with microscopes that use beams of electrons rather than light, but only by killing and slicing the specimen first, so living cells and the tiny structures in motion inside them couldn’t be observed.

Betzig and collaborators Wesley Legant, Kai Wang, Lin Shao and Bi-Chang Chen of Janelia Farm Research Campus all played a role in developing this newest microscope, which creates an image using a thin sheet of patterned light.

The fly movie is part of a collection of videos recorded with the new technology and published in the Oct. 24 Science paper.

One video in the paper shows specialized tubes inside cells called microtubules — roughly 2,000 times narrower than a human  hair — growing and shrinking as they help one cell split into two.

Other videos reveal the motions of individual cilia in a single-celled freshwater creature called Tetrahymena, or cells of a soil-dwelling slime mold banding together to form multicellular slugs.

Kiehart and Tulu will be going back to Janelia Farm in January to use the microscope again.

“For this visit we’re going to zoom in to a smaller area to look at individual cells,” Tulu said.

“Waking up the morning of October 8 and hearing on the radio that our paper includes a Nobel Prize winner was pretty special,” Kiehart said.

CITATION: “Lattice light-sheet microscopy: Imaging molecules to embryos at high spatiotemporal resolution,” Chen, B.-C., et al. Science, October 2014. http://www.sciencemag.org/content/346/6208/1257998

The Science of Self-Agency: Dr. Nicolelis and the Walk Again Project

By Olivia Zhu

Screen grab from Univision of Juliano's robo-kick at the World Cup opening ceremony.

Screen grab from Univision of Juliano’s robo-kick at the World Cup opening ceremony.

Over the course of his 20-year career, Dr. Miguel Nicolelis has restored movement and self-agency to paraplegic patients.

On November 11th, as part of the Grand Challenge Seminar Series, Dr. Nicolelis captivated his audience by explaining the extensive process that culminated in Juliano, a Brazilian 29-year-old paralyzed from the chest downward in a car accident, performing the opening kick of the World Cup simply by using his mind.

Dr. Nicolelis has several faculty appointments in the Duke School of Medicine, Department of Psychology and Neuroscience, Institute for Brain Sciences, and Center for Neuroengineering. He has also written a book, Beyond Boundaries, about his work. His program, Walk Again, is supported by the Edmond and Lily Safia International Institute of Neuroscience in Brazil.

Dr. Nicolelis began making progress in 1999-2000 at Duke by developing electrodes that could record firing from multiple neurons. Using this technology, he determined which neurons were necessary for a monkey to move a joystick during a video game. Then, Dr. Nicolelis focused on creating a bypass that would bridge the mind directly to a computer, essentially removing the body as an intermediary.

He called this bypass a “Brain-Machine Interface,” or BMI, a term he coined at a cheese steak joint outside of Philadelphia. With the BMI, Dr. Nicolelis’s monkeys could play the video game without moving their arms or the joystick—they simply imagined themselves moving the joystick. The monkeys could even use their arms to do other tasks like eat or scratch themselves, creating a “third arm.”

Since then, with an extensive team of engineers, Dr. Nicolelis has implemented this technology by creating a IMG_1941hydraulically-powered exoskeleton that interprets a patient’s firing neurons and moves a patient’s legs accordingly.

He has also created artificial “skin,” which provides tactile feedback of movement to a patient’s upper body or, eventually, through an implant directly to the tactile cortex of the brain.

The technology is so accurate that patients report feeling “ghost limbs”—they believe that their legs are actually walking. The legendary Brazilian soccer player, Ronaldo, reportedly exclaimed “I’m moving!” with incredulity, when he was strapped to a chair testing Nicolelis’s technology.

Training with the exoskeleton also improves patients’ cardiovascular circulation, mental health, gastrointestinal health, and sensitivity in previously paralyzed areas.

Dr. Nicolelis is truly using science to stretch the boundaries of the human body.

Page 16 of 20

Powered by WordPress & Theme by Anders Norén