by Anika Radiya-Dixit
Your college textbook pages probably look something like the picture below – traffic jams of black boats on a prosaic white sea.
But instead of reading purely from static texts, what if your chemistry class had 3D touch-screens that allowed you to manipulate the colors and positions of atoms to give you visual sense of how crystal and organic structures align with respect to each other? Or what if you could fold pieces of paper into different shapes to represent various combinations of protein structures? This is the future of science: visualization.
Duke students and staff gathered in the Levine Science Research Center last week to learn more about visualizing chemical compounds while munching on their chili and salad. Robert Hanson, Professor in the Department of Chemistry at St. Olaf College, was enthusiastic to present his research on new ways to visualize and understand experimental data.
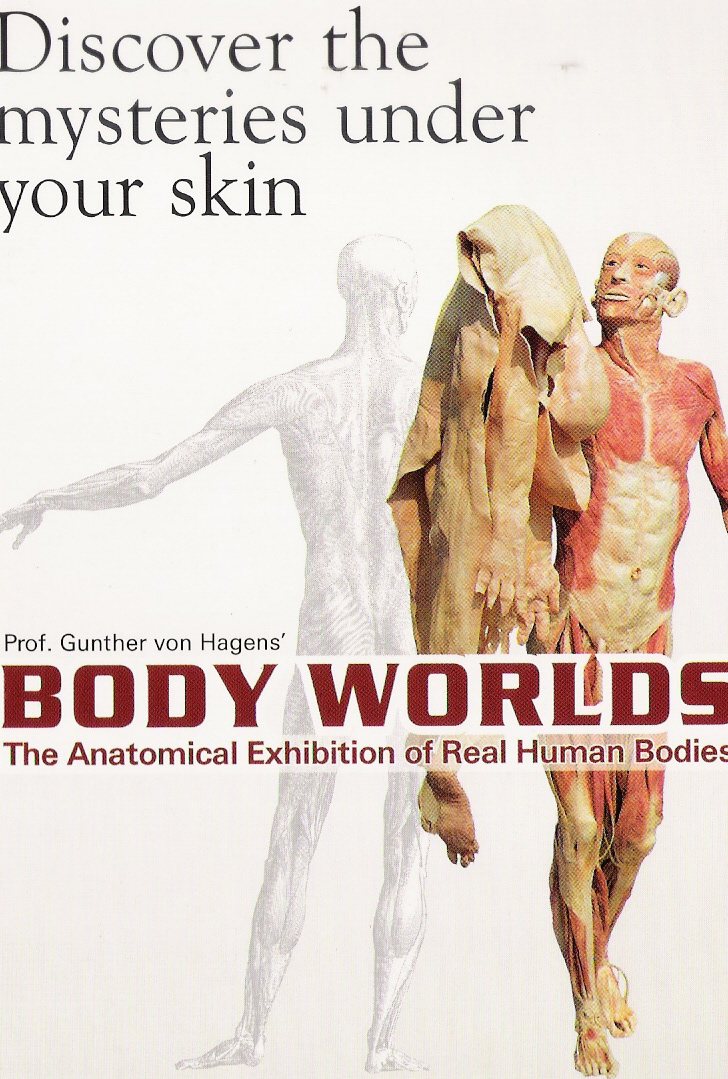
Hanson opened his talk with various applications of visualization in research. He expressed a huge respect for medical visualization and the people who are able to illustrate medical procedures, because “these artists are drawing what no one can see.” Take “Body Worlds,” for example, he said. One of the most renowned exhibitions displaying the artistic beauty of the human body, it elicited a myriad of reactions from the audience members, from mildly nauseated to animatedly pumped.
Hanson also spoke about the significance of having an effective visualization design. Very simple changes in visualization, such as a table of numbers versus a labeled graph, can make a “big difference in terms of ease of the audience catching on to what the data means.” For example, consider the excerpt of a textbook by J. Willard Gibbs below. One of the earliest chemists to study the relationship between pressure and temperature, Gibbs wrote “incredibly legible, detailed, verbatim notes,” Hanson said. Then he asked the audience: Honestly, would one read the text fervently, and if so, how easy would it be to understand these relationships?
Not very, according to James C. Maxwell, a distinguished mathematician and physicist, who attempted to design a simpler mechanism with his inverted 3D plaster model.
Subsequent scientists created the graph shown below to represent the relationships. Compared to the text, the diagram gives several different pieces of information about entropy and temperature and pressure that allow the reader to “simply observe and trace the graph to find various points of equilibrium that they couldn’t immediately understand” from a block of black and white text.
Hanson went further in his passion to bring chemistry to the physical realm in his book titled “Molecular Origami.” The reader photocopies or tears out a page from the book, and then folds up the piece of paper according to dotted guidelines in order to form origami molecular “ornaments.” The structures are marked with important pieces of information that allow students to observe and appreciate the symmetry and shapes of the various parts of the molecule.
One of his best moments with his work, Hanson recounted, was when he received a telephone call from some students in a high school asking him for directions on how to put together a 3D model of bone. After two hours of guiding the students, he asked the students what the model finally looked like – since he had knowledge of only the chemical components – and was amused to hear a cheeky “He doesn’t know.” Later that year, Hanson was rewarded to see the beautiful physical model displayed in a museum, and was overjoyed when he learned that his book was the inspiration for the students’ project.
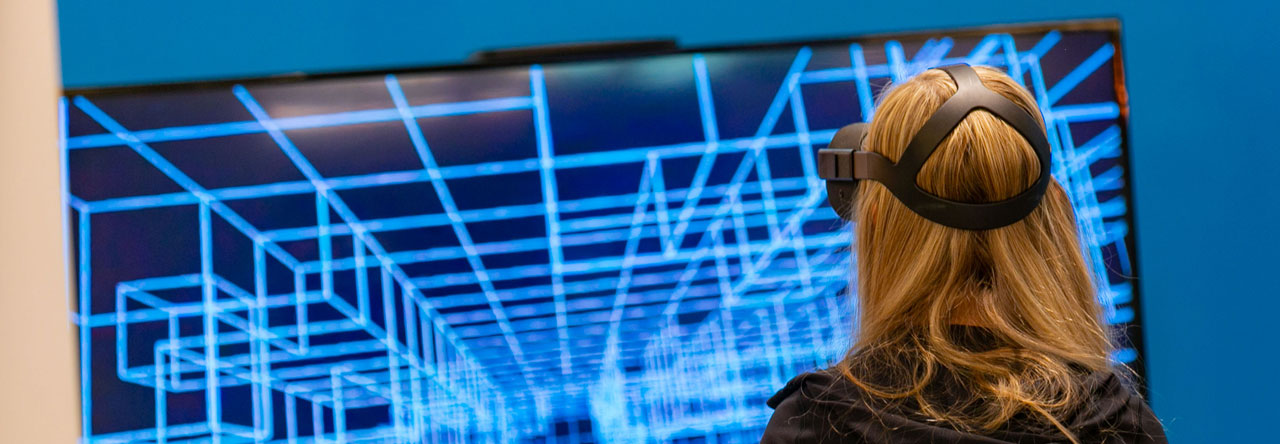
More recently, Hanson has worked on developing virtual software to view compounds in 3D complete with perspective scrolling. One of his computer visualizations is located in the “Take a Nanooze Break” exhibition in Disneyland, and allows the user to manipulate the color and location of atoms to explore various possible compounds.
By creating images and interactive software for chemical compounds, Hanson believes that good visualization can empower educators to gain new insights and make new discoveries at the atomic level. By experimenting with new techniques for dynamic imagery, Hanson pushes not only the “boundaries of visualization,” but more importantly, the “boundaries of science” itself.
Contact Professor Hanson at hansonr@stolaf.edu.
Read more about the event details here.
View Hanson’s book on “Molecular Origami” or buy a copy from Amazon.


