Following the people and events that make up the research community at Duke

Students exploring the Innovation Co-Lab

Category: Computers/Technology Page 15 of 20

So You Want to Be a Data Scientist

Ellie Burton’s summer job might be described as “dental detective.”

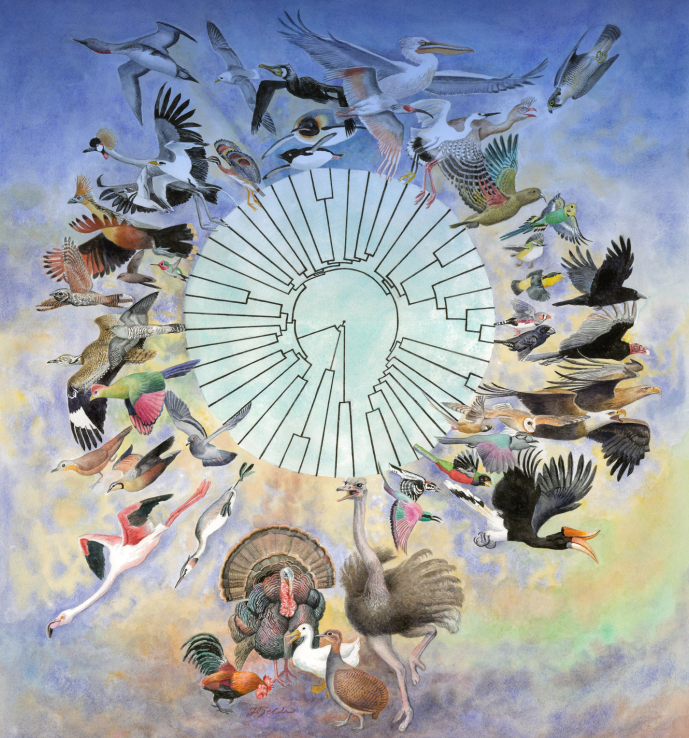
Using 3-D images of bones, she and teammates Kevin Kuo and GiSeok Choi are teaching a computer to calculate similarities between the fine bumps, grooves and ridges on teeth from dozens of lemurs, chimps and other animals.

They were among more than 50 students — majoring in everything from political science to engineering — who gathered on the third floor of Gross Hall this week for a lunch to share status updates on some unusual summer jobs.

The budding data scientists included 40 students selected for a summer research program at Duke called Data+. For ten weeks from mid-May to late July, students work in small teams on projects using real-world data.

Another group of students is working as high-tech weather forecasters.

Using a method called “topological data analysis,” Joy Patel and Hans Riess are trying to predict the trajectory and intensity of tropical cyclones based on data from Hurricane Isabel, a deadly hurricane that struck the eastern U.S. in 2003.

The student teams are finding that extracting useful information from noisy and complex data is no simple feat.

Some of the datasets are so large and sprawling that just loading them onto their computers is a challenge.

“Each of our hurricane datasets is a whopping five gigabytes,” said Patel, pointing to an ominous cloud of points representing things like wind speed and pressure.

They encounter other challenges along the way, such as how to deal with missing data.

Andy Cooper, Haoyang Gu and Yijun Li are analyzing data from Duke’s massive open online courses (MOOCs), not-for-credit courses available for free on the Internet.

Duke has offered dozens of MOOCs since launching the online education initiative in 2012. But when the students started sifting through the data there was just one problem: “A lot of people drop out,” Li said. “They log on and never do anything again.”

Some of the datasets also contain sensitive information, such as salaries or student grades. These require the students to apply special privacy or security measures to their code, or to use a special data repository called the SSRI Protected Research Data Network (PRDN).

Lucy Lu and Luke Raskopf are working on a project to gauge the success of job development programs in North Carolina.

One of the things they want to know is whether counties that receive financial incentives to help businesses relocate or expand in their area experience bigger wage boosts than those that don’t.

To find out, they’re analyzing data on more than 450 grants awarded between 2002 and 2012 to hundreds of companies, from Time Warner Cable to Ann’s House of Nuts.

Another group of students is analyzing people’s charitable giving behavior.

By looking at past giving history, YunChu Huang, Mike Gao and Army Tunjaicon are developing algorithms similar to those used by Netflix to help donors identify other nonprofits that might interest them (i.e., “If you care about Habitat for Humanity, you might also be interested in supporting Heifer International.”)

One of the cool things about the experience is if the students get stuck, they already know other students using the same programming language who they can turn to for help, said Duke mathematician Paul Bendich, who coordinates the program.

The other students in the 2015 Data+ program are Sachet Bangia, Nicholas Branson, David Clancy, Arjun Devarajan, Christine Delp, Bridget Dou, Spenser Easterbrook, Manchen (Mercy) Fang, Sophie Guo, Tess Harper, Brandon Ho, Alex Hong, Christopher Hong, Ethan Levine, Yanmin (Mike) Ma, Sharrin Manor, Hannah McCracken, Tianyi Mu , Kang Ni, Jeffrey Perkins, Molly Rosenstein, Raghav Saboo, Kelsey Sumner, Annie Tang, Aharon Walker, Kehan Zhang and Wuming Zhang.

Data+ is sponsored by the Information Initiative at Duke, the Social Sciences Research Institute and Bass Connections. Additional funding was provided by the National Science Foundation via a grant to the departments of mathematics and statistical science.

Writing by Robin Smith; video by Christine Delp and Hannah McCracken


Bird Consortium Wants to Run the Table

Just a few months after rolling out a huge package of studies on the genomics of 48 members of the bird family tree, an international consortium of scientists is announcing their new goal: sequencing all 10,000 species of birds in the next five years.

Erich Jarvis

Erich Jarvis is an associate professor of neurobiology in the medical school and a Howard Hughes Medical Institute investigator.

Called B10K for short, this effort should be the first attempt to sequence the genomes of all living species in a single class of vertebrates – and the most species-rich one at that.

The consortium announced their intentions in a letter appearing June 4 in Nature.

A genomic-level tree of life of the entire class should reveal links between genetic and phenotypic variation, perhaps reveal the evolution of biogeographical and biodiversity patterns across a wide-range of species, and maybe show the influences of ecology and human activity on species evolution.

But consortium co-leader, Erich Jarvis of Duke neurobiology, just loves birds for their minds. He is involved with the project to enhance his use of songbird brains as models of human speech.

Having proven the technical feasibility of the project and redrawn the bird phylogeny already, the consortium is now expanding to include experts in museum science, biogeography and ecology from the Kunming Institute of Zoology and Institute of Zoology of Chinese Academy of Science in Beijing; the Smithsonian Institution in the USA; and the Center of Macroecology, Evolution and Climate in Denmark. The complete list of contributing institutions and collaborators is listed on the B10K site.

B10K bird phylogeny

The new bird family tree drawn on complete genome sequencing of 48 species representing each major order. Painting by Jon Fjeldså.

“Given the small size and less complex features of bird genomes relative to other vertebrates, the ongoing advances in sequencing technologies, and the extensive availability of high quality tissue samples from birds deposited in museums around the world, reaching this ambitious goal is not only possible but also practical,” the consortium said in a prepared statement.

We look forward to many more exciting findings from B10K, but hopefully not all at once like last time.

-By Karl Leif Bates

Two Duke Teams Attempting to Map LinkedIn Universe

LinkedIn, the social media platform for career-related connections, has a huge problem.  The company has a grand vision of making the world economy more efficient at matching workers and jobs by completely mapping the data its 364 million users have posted about their skills, work history, education and professional networks.

http://www.stevenchanmd.com/weblog/2013/08/visualize-your-connections-through-linkedin/

The LinkedIn network of blogger Dr. Stephen Chan, circa 2013. (click to view larger)

But that turns out to be a much more gnarly problem than anyone expected. So, the company has done the Internet-age thing and crowd-sourced it.

Two Duke teams are among 11 selected last month from hundreds of proposals to participate in the company’s economic graph challenge. Selection means each team gets $25,000 (not quite enough for one grad student), a special secure LinkedIn laptop granting access to “a monitored sandbox environment,” and a mentor within the company who will stay in regular contact.

They’re supposed to deliver results in a year.

David Dunson of Duke

David Dunson, professor of statistical science

A Duke team lead by statistics professor David Dunson seeks to draw a richly detailed 3-D map of the network, making connections by education, skill set, employers and so on. “That’s incredibly difficult,” Dunson said. “With hundreds of millions of users, even a simple network would have 100 million-squared nodes, which is absurd.” His team hopes to develop algorithms to break the computation problems into manageable chunks.

This project, called “Find and change your position in a virtual professional world,” also includes statistics PhD student Joseph Futoma and Yan Shang, a PhD student in operations management at the Fuqua School of Business.

Katherine Heller, assistant professor of statistical and computer science

Katherine Heller, assistant professor of statistical and computer science

The other team is trying to pair whole-language analysis of user profiles with a three-dimensional map of a user’s network to speed job connections.

“We could have an awesome algorithm, but if it takes the age of the universe to run: ‘Hey, we’ve got a job for you — if you’re still alive!’” said Katherine Heller, an assistant professor of statistics and computer science. Her team, “Text Mining on Dynamic Graphs” also includes David Banks, professor of the practice in statistical science, and statistics PhD student Sayan Patra.

What the Duke teams are most excited about is the chance to tackle real-world data on a scale that few academics ever get a chance to work with. “These data are super-more interesting,” Dunson said. “It’s amazing to think of all the different things you could do with it.” If the academic teams come up with good solutions, they might be tools that could be used on other big-data problems, he added.

Even if the problems aren’t solved, LinkedIn’s contest has also built a good connection to the Duke campus, Heller notes. “It gives them access to seeing what’s going on in the department and possibly meeting some of the students,” she said.

And that’s the sort of thing that might lead to some new career connections.

http://www.searchenginejournal.com/

LinkedIn logo in their offices. (photo by Search Engine Journal)

-By Karl Leif Bates

Bringing a Lot of Energy to Research

By Karl Leif Bates

The Duke Energy Initiative‘s annual research collaboration workshop on May 5 was an update on how the campus-wide alliance of more than 130 faculty has been pursuing its goals of making energy  “accessible, affordable, reliable and clean.” In short, they’ve been busy!

energy posters

Energetic discussion swirled around research posters from graduate student projects and Bass Connections. (Photo: Margaret Lillard)

At the afternoon session in Gross Hall, David Mitzi, professor of mechanical engineering and materials science, led a panel of five-minute updates on energy materials including engineered microbes, computational modeling of materials, solar cells built on plastic rather than glass, and a nanomaterial-based sheet of material that would combine photovoltaics with storage on a single film.

Kyle Bradbury, managing director of the new Energy Data Analytics Lab that works with the ‘big data’ folks at iiD and the social scientists at SSRI, led a panel on the lab’s latest projects. As smart meters and Internet-enabled appliances enter the market, energy analysts will be flooded with new data, Bradbury explained. There should be great potential to improve efficiency and provide customers with useful real-time feedback, but first the torrent of information has to be corralled and analyzed.

energy panel

Kyle Bradbury (standing) moderated a data analytics panel with Leslie Collins and Matt Harding (right).

For one example of what big energy data might do, Bradbury and Electrical and Computer Engineering professor Leslie Collins (his former advisor) have done a pilot study to see if computers could be taught to  pick out roof-top solar arrays in satellite photos.  Nobody actually knows how many arrays there are or how much power they’re producing, Collins said. But without too much fussing around, their first visual search algorithm spotted 92 percent of the arrays correctly in some hand-picked images of California neighborhoods. Ramped up and tweaked, such an automated search could begin to identify just how much residential solar there is, where it is, and roughly how much energy it’s producing.

The third group of researchers, moderated by Energy Initiative associate Daniel Raimi, is working on energy markets and policy, including energy systems modeling and the regulation of green house gasses through the Clean Air Act.

Energy Initiative director Richard Newell said there were 1,400 Duke students enrolled in energy-related courses this year. A first round of six seed-funded research projects was completed and seven new projects have been selected. Eight Bass Connections teams in the energy theme were very productive as well, examining smart grids, solar energy and household energy conservation with teams of undergraduates, graduate students and faculty.

Geeky Goggles Let You Take a Field Trip Without Leaving Class

by Robin A. Smith

Kun Li of the Center for Instructional Technology and senior physics major Nicole Gagnon try out a virtual reality headset called Oculus Rift. Photo by Jeannine Sato.

Kun Li of the Center for Instructional Technology and senior physics major Nicole Gagnon try out a virtual reality headset called Oculus Rift. Photo by Jeannine Sato.

On the last day of class, just a few yards from students playing Twister and donning sumo suits, about two dozen people try on futuristic goggles in a windowless conference room.

Behind the clunky headgear, they are immersed in their own virtual worlds.

One woman peers inside a viewer and finds herself underwater, taking a virtual scuba tour.

The sound of breathing fills her headphones and bubbles float past her field of view.

When she looks left or right the image on the screen moves too, thanks to a tiny device called an accelerometer chip — the same gadget built into most smartphones that automatically changes the screen layout from landscape to portrait as the phone moves or tilts.

She turns her head to “swim” past corals and schools of fish. Suddenly a shark lunges at her and bares its razor teeth. “Whoa!” she yelps, taking a half-step back into a table.

A few feet away, virtual reality enthusiast Elliott Miller from Raleigh straps on something that looks like a pair of ski goggles and takes a hyperrealistic roller coaster ride.

He swivels in his office chair for a 100-degree view of the other passengers and the coaster’s corkscrews, twists and turns as he zips along at more than 60 miles per hour, in HD resolution.

“It feels pretty real. Especially when you’re going up a big drop,” Miller said.

Elliott Miller uses a virtual reality headset to take a ride on a real-life roller coaster in Sweden called the Helix. Photo by Jeannine Sato.

Elliott Miller uses a virtual reality headset to take a ride on a real-life roller coaster in Sweden called the Helix. Photo by Jeannine Sato.

Duke senior Nicole Gagnon declines a ride. “I get motion sick,” she said.

Virtual reality headsets like these aren’t in use in Duke classrooms — at least not yet.

Since its beginnings in the mid-1980s, the technology has mostly been developed for the gaming industry.

“[But] with virtual reality becoming more widespread, it won’t be long before it makes it to the classroom,” said Seth Anderson from Duke’s Center for Instructional Technology.

Duke chemistry professor Amanda Hargrove and postdoc Gary Kapral have been testing out ways to use the devices in their chemistry courses.

Thanks to funding from the Duke Digital Initiative, they designed a program that shrinks students down to the size of a molecule and lets them explore proteins and nucleic acids in 3-D.

“We call this demo the ‘Molecular Jungle Gym,’” Kapral said. “You can actually go inside, say, a strand of RNA, and stand in the middle and look around.”

The pilot version uses a standard Xbox-style controller to help students understand how proteins and nucleic acids interact with each other and with other kinds of molecules — key concepts for things like drug design.

Kapral has found that students who use virtual reality show better understanding and retention than students who view the same molecules on a standard computer screen.

“The Duke immersive Virtual Environment (DiVE) facility has been doing this for a long time, but you have to physically go there,” said Elizabeth Evans of the Duke Digital Initiative. “What makes virtual reality headsets like these different is they make virtual reality not only portable but also affordable.”

Duke student Nicole Gagnon peers through a cardboard viewer that turns any smartphone into a virtual reality headset. Photo by Jeannine Sato.

Duke student Nicole Gagnon peers through a cardboard viewer that turns any smartphone into a virtual reality headset. Photo by Jeannine Sato.

Of course, “affordable” is relative. The devices Kapral and Hargrove are using cost more than $300 per headset. But for less than 20 dollars, anyone can turn a smartphone into a virtual reality headset using a simple kit from makers like Google Cardboard, which designs viewers made of folded cardboard.

Critics of virtual reality technology say it’s just another form of escapism, after TV, the Internet and smartphones.

But educational technology advocates see it as a way to help students see and hear and interact with things that would be impossible otherwise, or only available to a lucky few:  to travel back in time and take virtual field trips to historic battlefields as cannon fire fills the air, to visit archeological sites and examine one-of-a-kind cultural artifacts from different angles, or experience different climate change scenarios predicted for the future.

“It’s hard to imagine what one inch versus one foot of sea level rise means unless you stand on a beach and experience it,” Evans said. “Virtual reality could let us give students experiences that are too expensive, too dangerous, or too rare to give them in real life.”

Kapral agrees: “One day students could even do chemistry experiments without worrying about blowing things up.”

Join the mailing list for virtual reality at Duke: https://lists.duke.edu/sympa/subscribe/vr2learn

In a free mobile app called SeaWorld VR, the screen displays two images side by side that the viewer’s brain turns into a 3-D image:

https://www.youtube.com/watch?v=bAlLSGVXLOE

Geometry of Harmony in Impressionist Music

by Anika Radiya-Dixit

Like impressionist art – such as Monet’s work Sunset – impressionist music does not have fixed structures. Both artforms use the art of abstraction to give a sense of the theme of the work.

On the other hand, classical music, such as sonatas, flows with a rhythmic beat with a clear beginning, middle, and end to the work.

Since there is little theoretical study on the compositional patterns of the contemporary style of music, Duke senior Rowena Gan finds the mathematical exploration of impressionist music quite exciting, as she expressed in her senior thesis presentation April 17.

Sunset: Impressionist art by Claude Monet

Sunset: Impressionist art by Claude Monet

Classical music is well known for its characteristic chord progressions, which can be geometrically represented with a torus – or a product of circles – as shown in the figure below.

Torus depicting C major in orange highlight and D minor in blue highlight

Torus depicting C major in orange highlight and D minor in blue highlight

By numbering each note, the Neo-Riemannian theory can be used to explain chord progressions in classical music by finding mathematical operations to describe the transitions between the chords.

Expressing chord progressions as mathematical operations

Expressing chord progressions as mathematical operations

asic transformations between chords described by the Neo-Riemannian theory.

Basic transformations between chords described by the Neo-Riemannian theory.

Similar to a chord, a scale is also a collection of notes. In classical music, scales typically played have seven notes, such as the C major scale below:

C Major Scale.

C Major Scale.

Impressionist music, however, is marked by the use of exotic scales with different numbers of notes that tend to start at notes off the key center. In that case, how do we represent scales in Impressionist music? One of the ways of representation that Gan explored is by determining the distance between the scales – called interscalar distance – by depicting each scale as a point, and comparing this value to the modulation frequency.

Essentially, the modulation frequency is determined by varying the frequency of the audio wave in order to carry information; a wider range of frequencies corresponds to a higher modulation frequency. For example, the modulation frequency is the same for the pair of notes of D and E as well as F and G, which both have lower modulation frequencies than between notes D and G.

Gan calculated the correlation between modulation frequency and interscalar distance for various musical pieces and found the value to be higher for classical music than for impressionist music. This means that impressionist music is less homogenous and contains a greater variety of non-traditional scale forms.

Gan explores more detailed findings in her paper, which will be completed this year.

Rowena Gan is a senior at Duke in Mathematics. She conducted her research under Professor Ezra Miller, who can be contacted via email here.

Lights. Camera. Action. Sharpen.

by Anika Radiya-Dixit

On Friday, April 10, while campus was abuzz with Blue Devil Days, a series of programs for newly admitted students, a group of digital image buffs gathered in the Levine Science Research Center to learn about the latest research on image and video de-blurring from Duke electrical and computer engineering professor Guillermo Sapiro. Professor Sapiro specializes in image and signal analysis in the department of Computer and Electrical Engineering in Duke’s Pratt School of Engineering. Working alongside Duke postdoctoral researcher Mauricio Delbracio, Sapiro has been researching methods to remove image blur due to camera shake.

Sapiro’s proposed algorithm is called burst photography, which achieves “state-of-the-art results an order of magnitude faster, with simplicity for on-board implementation on camera phones.” As shown in the image below, this technique combines multiple images, where each has a random camera shake and therefore each image in the burst is blurred slightly differently.

Professor Sapiro explains the basic principle of burst photography.

Professor Sapiro explains the basic principle of burst photography.

To de-blur the image, Sapiro’s algorithm then aligns the images together using a gyroscope and combines them in the Fourier domain. The final result essentially takes the best parts of each slightly-blurred image — such as the ones below — and gives sharpened images a greater weight when averaging blurred images in the burst.

Set of images with varying degrees of linear blur.

Set of images with varying degrees of linear blur.

This technique also produces phenomenal effects in video sharpening by collapsing multiple blurred frames into a single sharpened picture:

Contrast between sample frame of original video (left) with FBA sharpened video (right).

Contrast between sample frame of original video (left) with FBA sharpened video (right).

One impressive feature of burst photography is that it allows the user to obtain a mixed-exposure image by taking multiple images at various levels of exposure, as can be seen in parts (a) and (b) in the figure below, and then combining these images to produce a splendid picture (c) with captivating special effects.

Result of FBA algorithm on combining images with various levels of exposure.

Result of FBA algorithm on combining images with various levels of exposure.

If you are interested in video and image processing, email Professor Sapiro or check out his lab.

Got Data? 200+ Crunch Numbers for Duke DataFest

Photos by Rita Lo; Writing by Robin Smith

While many students’ eyes were on the NCAA Tournament this weekend, a different kind of tournament was taking place at the Edge. Students from Duke and five other area schools set up camp amidst a jumble of laptops and power cords and white boards for DataFest, a 48-hour stats competition with real-world data. Now in its fourth year at Duke, the event has grown from roughly two dozen students to more than 220 participants.

Teams of two to five students had 48 hours to make sense of a single data set. The data was kept secret until the start of the competition Friday night. Consisting of visitor info from a popular comparison shopping site, it was spread across five tables and several million rows.

“The size and complexity of the data set took me by surprise,” said junior David Clancy.

For many, it was their first experience with real-world data. “In most courses, the problems are guided and it is very clear what you need to accomplish and how,” said Duke junior Tori Hall. “DataFest is much more like the real world, where you’re given data and have to find your own way to produce something meaningful.”

“I didn’t expect the challenge to be so open-ended,” said Duke junior Greg Poore. “The stakeholder literally ended their ‘pitch’ to the participants with the company’s goals and let us loose from there.”

As they began exploring the data, the Poke.R team discovered that 1 in 4 customers spend more than they planned. The team then set about finding ways of helping the company identify these “dream customers” ahead of time based on their demographics and web browsing behavior — findings that won them first place in the “best insight” category.

“On Saturday afternoon, after 24 hours of working, we found all the models we tried failed miserably,” said team member Hong Xu. “But we didn’t give up and brainstormed and discussed our problems with the VIP consultants. They gave us invaluable insights and suggestions.”

Consultants from businesses and area schools stayed on hand until midnight on both Friday and Saturday to answer questions. Finally, on Sunday afternoon the teams presented their ideas to the judges.

Seniors Matt Tyler and Justin Yu of the Type 3 Errors team combined the assigned data set with outside data on political preferences to find out if people from red or blue cities were more likely to buy eco-friendly products.

“I particularly enjoyed DataFest because it encouraged interdisciplinary collaboration, not only between members from fields such as statistics, math, and engineering, but it also economics, sociology, and, in our case, political science,” Yu said.

The Bayes’ Anatomy team won the best visualization category by illustrating trends in customer preferences with a flow diagram and a network graph aimed at improving the company’s targeting advertising.

“I was just very happily surprised to win!” said team member and Duke junior Michael Lin.

Blake Wilson: Pioneer of the Modern Cochlear Implant

By Anika Ayyar

Despite severe hearing difficulties, William H. Gates Sr. sat listening to his son, Bill Gates, deliver an acceptance speech after winning a Lasker Award for Public Service in 2013. He was able to participate in this momentous occasion thanks to his cochlear implant, an electronic device that simulates the functions of the cochlea (a cavity in the inner ear) by transmitting sound signals to the brain.

Coincidentally, three of the masterminds behind this very device were also present at the same ceremony, as they themselves were being awarded Lasker Awards for their work developing the modern cochlear implant. Blake Wilson, one of these scientists, noted during his speech at Duke last week that it was quite an experience for them to watch a device they had pioneered transform a personal interaction between William Gates Sr. and his son, right before their eyes.

Blake Wilson displays a cochlear implant.

Blake Wilson displays a cochlear implant.

Rewind 50 years, and few people would have paused to even consider the possibility of such a device that could capture sound signals and make them audible to individuals whose ears were damaged. Physiologist Merle Lawrence stated in 1964 that stimulation of auditory nerves would never result in perception of speech, while Rainer Klinke, a German neurophysiologist, went as far as to claim that “from a physiological point of view, cochlear implants [would] not work”.

Luckily, Blake Wilson thought differently. Starting in the 1980’s, he worked with teams across the globe, from the US, to Belgium, to Australia, to develop an innovative device that was able to process sound waves. As of 2015, this innovation has restored hearing capabilities to more than 450,000 individuals.

The path to generating an effective cochlear implant was characterized by continuous discovery and improvement. The first step in the process was simply to build a safe electronic device that had a lifespan of many years. This device was engineered to generate artificial electrical stimuli that triggered neurons in deaf individuals, whose sensory cells do not respond to the body’s chemical signals.

Diagram of cochlear implant in the human ear.

Diagram of cochlear implant in the human ear.

As the diagram on the right shows, both external (radio receiving and transmitting coils, processing chip) and internal (an array of electrodes around the helical structure of the inner ear) components work together in a cochlear implant to allow for speech recognition and hearing capabilities without the functionality of the cochlea’s natural functions.

Once scientists successfully engineered a device that stimulated the inner ear without causing any harm, teams in Palo Alto, Vienna, and Melbourne worked to enhance the implant by utilizing the tonotopic arrangement of the human auditory system. Stanford Professor Blair Simmons discovered that cadence, in addition to place of stimulation, was an important aspect of auditory signals, and he spearheaded experiments that sent different pulses to different electrodes in order to create a variety of perceptions of pitch.

By 1988, the NIH said that 1 in 20 patients who had received cochlear implants were able to carry out normal conversations without lip reading- a phenomenal accomplishment. The Consensus Statement also suggested that multichannel implants might be more effective than single-channeled ones, an idea that brought Wilson from Palo Alto to Duke in 1989, where he began to research multilateral stimulation. With support from the Research Triangle Institute, as well as members of the Duke community such as Dean Katsouleas of the Pratt School, Wilson was able to provide bilateral electrical stimulation to patients, by combining electric and acoustic methods for people who had residual, low frequency hearing. He also worked with colleagues to compress the range of sounds in the environment to a narrower range that could be transmitted to patients, by using filters to divide sounds into different frequencies.

Screen Shot 2015-03-11 at 5.26.26 PM

Blake Wilson converses with a user of a cochlear implant. The joy in the individual’s face is clear- and she is able to understand Wilson clearly!

Together, these prominent advances as well as numerous others fueled the evolution of the modern cochlear implant, which is projected to reach more than one million deaf and hearing-impaired individuals by 2020.

Listening to Wilson describe the history and progress of the project made it clear that the modern cochlear implant is not only a revolutionary creation in itself, but also that it holds enormous potential as a model for further development of other neural processes, such as restoration of vision and balance. Perhaps the most inspirational part of Wilson’s presentation however, was his description of the profound joy experienced by patients, doctors, and families whenever a cochlear implant restores auditory capability to an individual who otherwise never dreamt it possible to be able to hear.

Blake Wilson can be contacted at blake.wilson@duke.edu

To learn more about the event, please visit this page.

View the entire lecture, with introductions by Provost Sally Kornbluth and Dean Tom Katsouleas of the Pratt School of Engineering. (1:08)

Joining the Team: Anika Ayyar

By Anika Ayyar

Hi! My name is Anika Ayyar and I am currently a Duke freshman. I grew up in warm, lovely Saratoga, California, where I picked up my love for long distance running, organic farming, and the ocean. When I was 14, I moved to across the country to Exeter, New Hampshire to attend a boarding high school, and here I developed a deep interest in biology and medicine. Exeter’s frost and snow were far from the Cali weather I was used to, but my fascinating classes, caring teachers, and wonderful friends more than made up for the cold.

My sophomore semester abroad program at The Island School, on an island called Eleuthera in the Bahamas, certainly provided a welcome change to East coast weather as well. At the Island School I studied marine biology and environmental conservation, earned my SCUBA certification, and spent time with the local middle schoolers refurbishing a library and stocking it with books. I was also part of a research team that studied species richness and diversity on patch reefs off the coast of the island.

Dissecting fruit fly larvae under the microscope at the Seung Kim Lab at Stanford.

Dissecting fruit fly larvae under the microscope at the Seung Kim Lab at Stanford.

My marine research stint in the Bahamas drove me to join a molecular biology lab the summer after I returned; a decision that transformed my passion for science. At the Seung Kim Lab for Pancreas Development at Stanford University, I worked on a project that used binary systems to study the expression of specific genes related to insulin production and diabetes in fruit flies. I soon grew so immersed in my work that I wanted to share the project with others in the scientific community at Exeter, and my research mentors, biology professors, and I worked to create a novel course where other students could take part in the project as well. This unique research collaboration, called the “StanEx” project, proved to be a huge success, allowing other students to experience the trials and joys of real-world research while also generating Drosophila fly strains that were useful to the larger scientific community. If you are interested in reading more, check out my website about the StanEx project!

While my current interests lie more at the intersection of technology and medicine, I hope to be involved in equally compelling and fulfilling research here at Duke. Hearing about the various projects my professors are working on, and reading about the discoveries made in labs on campus, I have no doubt that this will be the case.

Outside of classes and research, I enjoy being part of the Duke Debate team, and Lady Blue, one of Duke’s all-female a cappella groups. You can often find me on the trails on a long run, or trying out a new dessert recipe I found on Pinterest. I am beyond excited to be a part of the research blogging team, and can’t wait to start attending talks and interviewing research personalities whose stories I can share with our readers!

Page 15 of 20

Powered by WordPress & Theme by Anders Norén