Photos by Rita Lo; Writing by Robin Smith
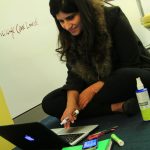
While many students’ eyes were on the NCAA Tournament this weekend, a different kind of tournament was taking place at the Edge. Students from Duke and five other area schools set up camp amidst a jumble of laptops and power cords and white boards for DataFest, a 48-hour stats competition with real-world data. Now in its fourth year at Duke, the event has grown from roughly two dozen students to more than 220 participants.
Teams of two to five students had 48 hours to make sense of a single data set. The data was kept secret until the start of the competition Friday night. Consisting of visitor info from a popular comparison shopping site, it was spread across five tables and several million rows.
“The size and complexity of the data set took me by surprise,” said junior David Clancy.
For many, it was their first experience with real-world data. “In most courses, the problems are guided and it is very clear what you need to accomplish and how,” said Duke junior Tori Hall. “DataFest is much more like the real world, where you’re given data and have to find your own way to produce something meaningful.”
“I didn’t expect the challenge to be so open-ended,” said Duke junior Greg Poore. “The stakeholder literally ended their ‘pitch’ to the participants with the company’s goals and let us loose from there.”
- Winners of best visualization: Greg Poore, Tori Hall, Michael Lin and David Clancy of the team Bayes’ Anatomy
- Winners of best insight:, Yang Su, Ruofei Wang, Yiyun Gu, Hong Xu and Yikun Zhou of the team Poke.R
- Winners of best use of outside data: Matt Tyler and Justin Yu of the team Type 3 Errors
As they began exploring the data, the Poke.R team discovered that 1 in 4 customers spend more than they planned. The team then set about finding ways of helping the company identify these “dream customers” ahead of time based on their demographics and web browsing behavior — findings that won them first place in the “best insight” category.
“On Saturday afternoon, after 24 hours of working, we found all the models we tried failed miserably,” said team member Hong Xu. “But we didn’t give up and brainstormed and discussed our problems with the VIP consultants. They gave us invaluable insights and suggestions.”
Consultants from businesses and area schools stayed on hand until midnight on both Friday and Saturday to answer questions. Finally, on Sunday afternoon the teams presented their ideas to the judges.
Seniors Matt Tyler and Justin Yu of the Type 3 Errors team combined the assigned data set with outside data on political preferences to find out if people from red or blue cities were more likely to buy eco-friendly products.
“I particularly enjoyed DataFest because it encouraged interdisciplinary collaboration, not only between members from fields such as statistics, math, and engineering, but it also economics, sociology, and, in our case, political science,” Yu said.
The Bayes’ Anatomy team won the best visualization category by illustrating trends in customer preferences with a flow diagram and a network graph aimed at improving the company’s targeting advertising.
“I was just very happily surprised to win!” said team member and Duke junior Michael Lin.


