DURHAM, N.C. — First it was Alpha. Then Delta. Now Omicron and its alphabet soup of subvariants. In the three years since the coronavirus pandemic started, every few months or so a new strain seems to go around, only to be outdone by the next one.
If the constant rise and fall of new coronavirus variants has left you feeling dizzy, you’re not alone. But where most people see a pandemic roller coaster, one Duke team sees a mathematical pattern.
In a new study, a group of students led by Duke mathematician Rick Durrett studied the calculus behind the pandemic’s waves.
Published Nov. 2022 in the journal Proceedings of the National Academy of Sciences, their study got its start as part of an 8-week summer research program called DOmath, now known as Math+, which brings undergraduates together to collaborate on a faculty-led project.
Their mission: to build and analyze simple mathematical models to understand the spread of COVID-19 as one strain after another popped up and then rose to outcompete the others.
In an interview about their research, project manager and Duke Ph.D. student Hwai-Ray Tung pointed to a squiggly line showing the number of confirmed COVID cases per capita in the U.S. between January 2020 and October 2022.
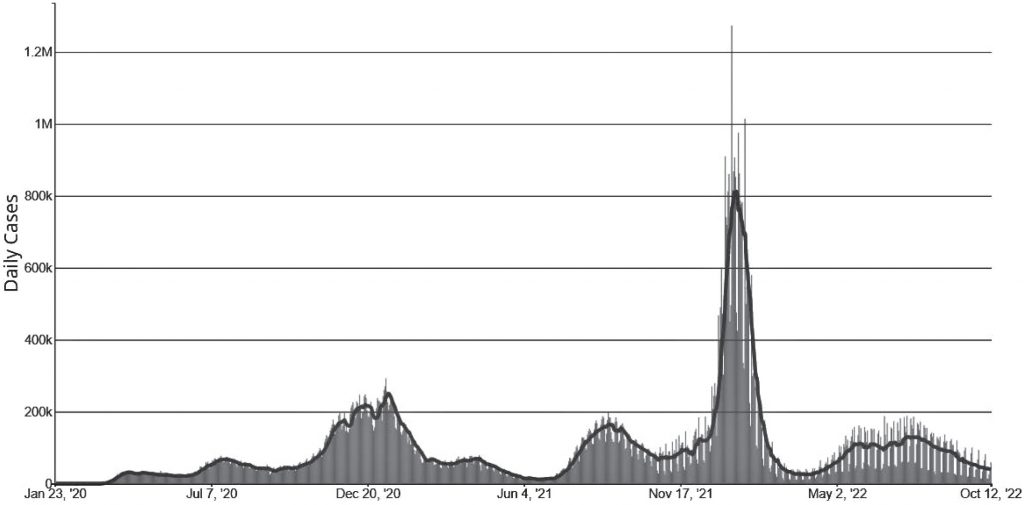
“You can see very distinct humps,” Tung said.
The COVID pandemic has unfolded in a series of surges and lulls — spikes in infection followed by downturns in case counts.
The ups and downs are partly explained by factors such as behavior, relaxation of public policies, and waning immunity from vaccines. But much of the roller coaster has been driven by changes to the coronavirus itself.
All viruses change over time, evolving mutations in their genetic makeup as they spread and replicate. Most mutations are harmless, but every so often some of them give the virus an edge: Enabling it to break into cells more easily than other strains, better evade immunity from vaccines and past infection, or make more copies of itself in order to spread more effectively.
Take the Delta variant, for example. When it first started going around in the U.S. in May 2021, it was responsible for just 1% of COVID cases. But thanks to mutations that helped the virus evade antibodies and infect cells more easily, it quickly tore across the country. Within two months it had outcompeted all the other variants and rose to the top spot, causing 94% of new infections.
“The natural question to ask is: What’s going on with the transition between these different variants?” Tung said.
For their study the team developed a simple epidemic model called an SIR model, which uses differential equations to compute the spread of disease over time.
SIR models work by categorizing individuals as either susceptible to getting sick, currently infected, or recovered. The team modified this model to have two types of infected individuals and two types of recovered individuals, one for each of two circulating strains.
The model assumes that each infectious person spreads the virus to a certain number of new people per day (while sparing others), and that, each day, a certain fraction of the currently infected group recovers.
In the study, the team applied the SIR model to data from a database called GISAID, which contains SARS-CoV-2 virus sequences from the pandemic. By looking at the coronavirus’s genetic code, researchers can tell which variants are causing infection.

Study co-author Jenny Huang ’23 pointed to a series of S-shaped curves showing the fraction of infections due to each strain from one week to the next, from January 2021 to June 2022.
When they plotted the data as points on a graph, they found that it followed a logistic differential equation as each new variant emerged, rose steeply, and — within six to 10 weeks — quickly displaced its predecessors, only to be taken over later by even more aggressive or contagious strains.
Durrett said it’s the mathematical equivalent of something biologists call a selective sweep, when natural selection increases a variant’s frequency from low to high, until nearly everyone getting stick is infected with the same strain.
“I’ve been interested in epidemic modeling since the end of freshman year when COVID started,” said Huang, a senior who plans to pursue a Ph.D. in statistics next year with support from a prestigious Quad Fellowship.
They’re not all typical math majors, Durrett said of his team. Co-author Sofia Hletko, ’25, was a walk-on to the rowing team. Laura Boyle ’24 was a Cameron Crazie.
For some team members it was their first experience with mathematical research: “I came in having no idea what a differential equation was,” Boyle said. “And by the end, I was the person in the group explaining that part of our presentation to everyone.”
Boyle says one question she keeps getting asked is: what about the next COVID surge?
“It’s very hard to say what will happen,” Boyle said.
The teams says their research can’t predict future waves. Part of the reason is the scanty data on the actual number of infections.
Countries have dialed back on their surveillance testing, and fewer places are doing the genomic sequencing necessary to identify different strains.
“We don’t know the nature of future mutations,” Durrett said. “Changes in people’s behavior will have a significant impact too.”
“The point of this paper wasn’t to predict; rather it was to explain why the waves were occurring,” Huang said. “We were trying to explain a complicated phenomenon in a simple way.”
This research was supported by a grant from the National Science Foundation (DMS 1809967) and by Duke’s Department of Mathematics.
CITATION: “Selective Sweeps in SARS-CoV-2 Variant Competition,” Laura Boyle, Sofia Hletko, Jenny Huang, June Lee, Gaurav Pallod, Hwai-Ray Tung, and Richard Durrett. Proceedings of the National Academy of Sciences, Nov. 3, 2022. DOI: 10.1073/pnas.2213879119.