Australia. For years it was more of a nebulous concept to me than a concrete place. It was a colorful patch on maps, home to animals I’d read about but never seen. Now it’s a place where I’ve run my hands over 1.9-billion-year-old stone, watched a platypus emerge from a river at dawn, gotten bitten on the tongue by an ant with a tasty green butt (long story), and spent a thousand other moments with wonderful people in places I hope to never forget.
That’s all thanks to Duke in Australia, a month-long biogeography course led by Alex Glass, Ph.D., and Nancy Lauer, Ph.D., that delves into Australian flora, fauna, geology, history, and culture. When people ask about my experience there this summer, I have a hard time answering. “Wonderful” doesn’t begin to cover it. The experience still doesn’t feel entirely real to me. Even when I was in Australia, watching a platypus or a parrot or standing on a beach with a sunrise on one side and a rainbow on the other, I sometimes couldn’t entirely believe where I was.
Disclaimer: When I say “Highlights from Duke in Australia,” I’m referring to my own personal highlights—some of which, let me assure you, were not universally popular with my classmates. Like the enormous crickets we saw on our rainforest night hike, or the time I found the shed skin of a huntsman spider and went around showing it to everyone nearby, or the delightfully squelchy mud coating the trail on one of our last hikes. For more detailed accounts of our day-to-day activities, check out the student blogs on the Duke in Australia 2023 website.
From the moment we landed in Sydney, I was keeping my eyes peeled for bird sightings. (I am slightly into birds. Just slightly.) Unless you count an ambiguous white flash seen through a bus window, my first bird sighting in Australia was a small group of rainbow lorikeets flying over the city. With a blue head and stomach, a green back, an orange-red breast, and flashes of yellow under the wings, the species is very well named.
Lorikeets weren’t the only birds we saw in Sydney. Common mynas, which always looked vaguely sinister to me, watched us while we ate dinner the first night. Pigeons strutted along the sidewalks—the only bird species I saw in Australia that I’d also seen in the US, except a possible peregrine falcon that I caught only a brief glimpse of during a hike. There were also Australian ibises all over the city, colloquially known as bin chickens for their dumpster-diving habits. Personally, I thought the ibises were lovely, regal birds.
There are other birds, however, that can no longer call Sydney home. One of my favorite sites in Sydney was the Forgotten Songs art installation at Angel Place. It is a short alley engraved with the names of fifty bird species that can no longer survive in the city. Empty bird cages hang suspended above the street. Our tour guide told us that the exhibit normally plays recordings of the birds, but that part was under renovation, so it was playing music instead. A few days later, I returned to the exhibit on my own so I’d have time to read every bird name. Those empty cages still haunt me.

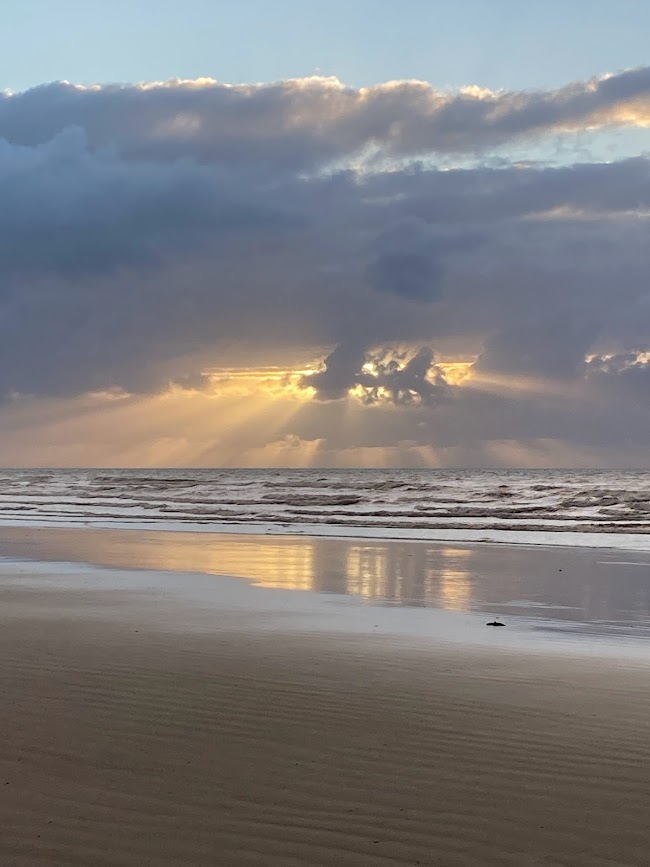
On our first full day in Sydney, we went to Bondi Beach to explore the tidepools. There were crabs and octopi, seastars and anemones, necklace-like algae and tiny blue snails called little blue periwinkles. That afternoon, we sat on the beach and learned about microplastics from Lauer. (Not-so-fun fact: we eat a credit card’s worth of microplastics every week on average.) Some of us lingered on the beach afterward and went swimming. The water was frigid, but it was there, with cold water and sand swirling around me in a part of the ocean I’d never seen, much less swum in, that the reality of being on a new continent completely hit me.
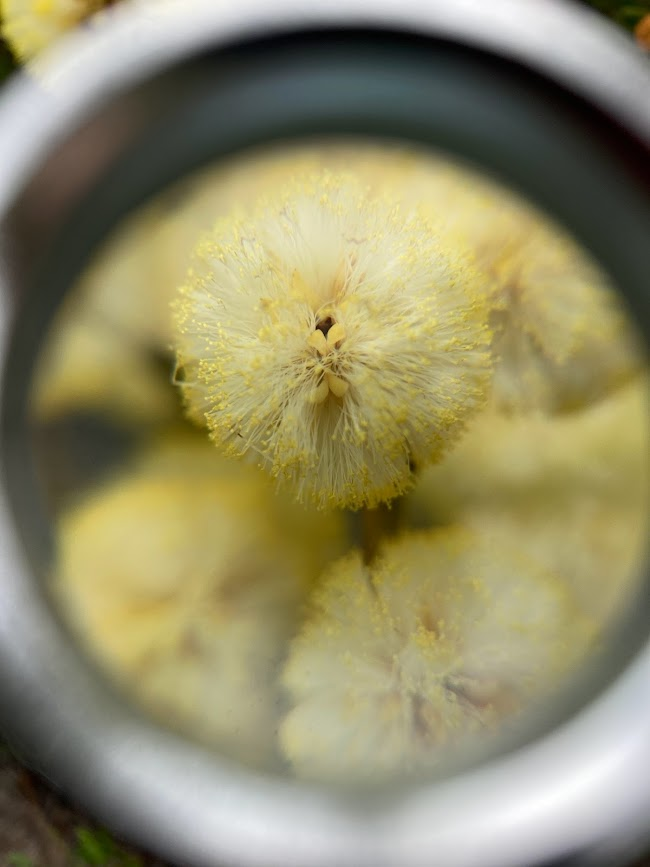
Our first group hike was overwhelming, almost dizzying. Outside of urban Sydney, it was easier for me to recognize just how different Australia was from the US, and it was impossible to absorb everything at once. In every direction were unfamiliar plants and landscapes. Norfolk pine, coastal rosemary, mountain devil, sunshine wattle, Darwinia, flannel flower, gray spider flower…. I was especially entranced by casuarina, which looks shockingly like a pine tree but is actually a flowering plant that has evolved conifer-like traits to preserve water. We were in a heath, characterized by low-growing plants adapted to dry, nutrient-poor conditions. Nothing about it looked like the woods and fields and mountains back home.
Our focus that day was studying plants, but I was having a hard time focusing on any one thing for more than about a second. At one point, we were supposed to be observing a beautiful plant to my right, but half the group had already moved on to another species farther up the trail, and meanwhile, a bird I had certainly never seen in my life was perched remarkably cooperatively on a bush off to the left. There are too many things happening, I remember thinking. I was juggling my field notebook, hand lens, phone camera, and binoculars, and I didn’t even know where to look. I chose to stare at the bird, following the logic that it could fly away at any moment, whereas the plants would stay exactly where they were. That brilliant plan turned out to be faulty. The plants might stay still, but we wouldn’t—so much to see, so little time.
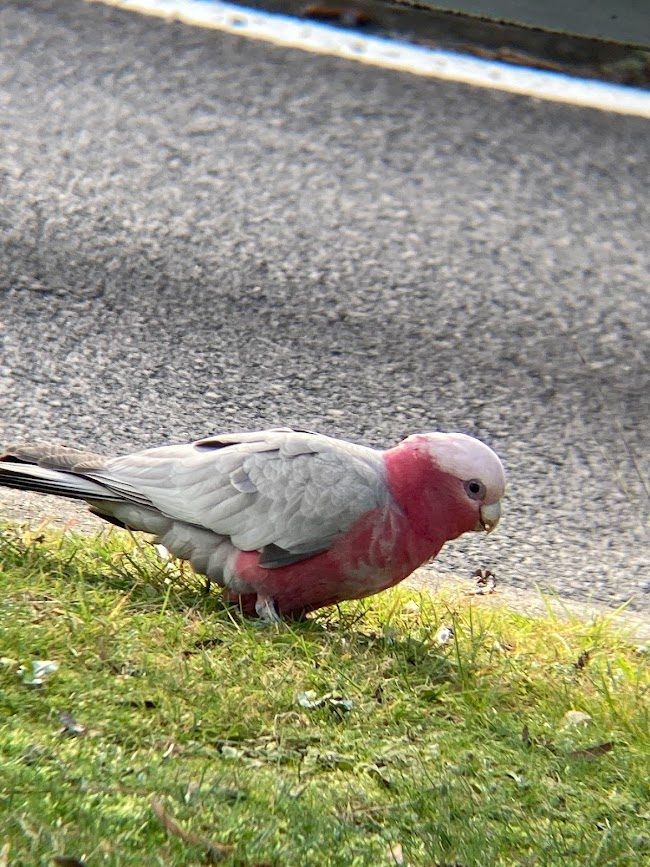
Our next stop was Katoomba, a small mountain town in New South Wales. It was a quiet, peaceful place, vastly different from Sydney. When I think of Katoomba, I think of the sulfur-crested cockatoo perched on a bakery sign just feet away from me and the flock of strikingly pink cockatoos called galahs in a local park. I think of the superb lyrebird that crossed our path directly in front of us and the rare Wollemi pine growing beside a road.
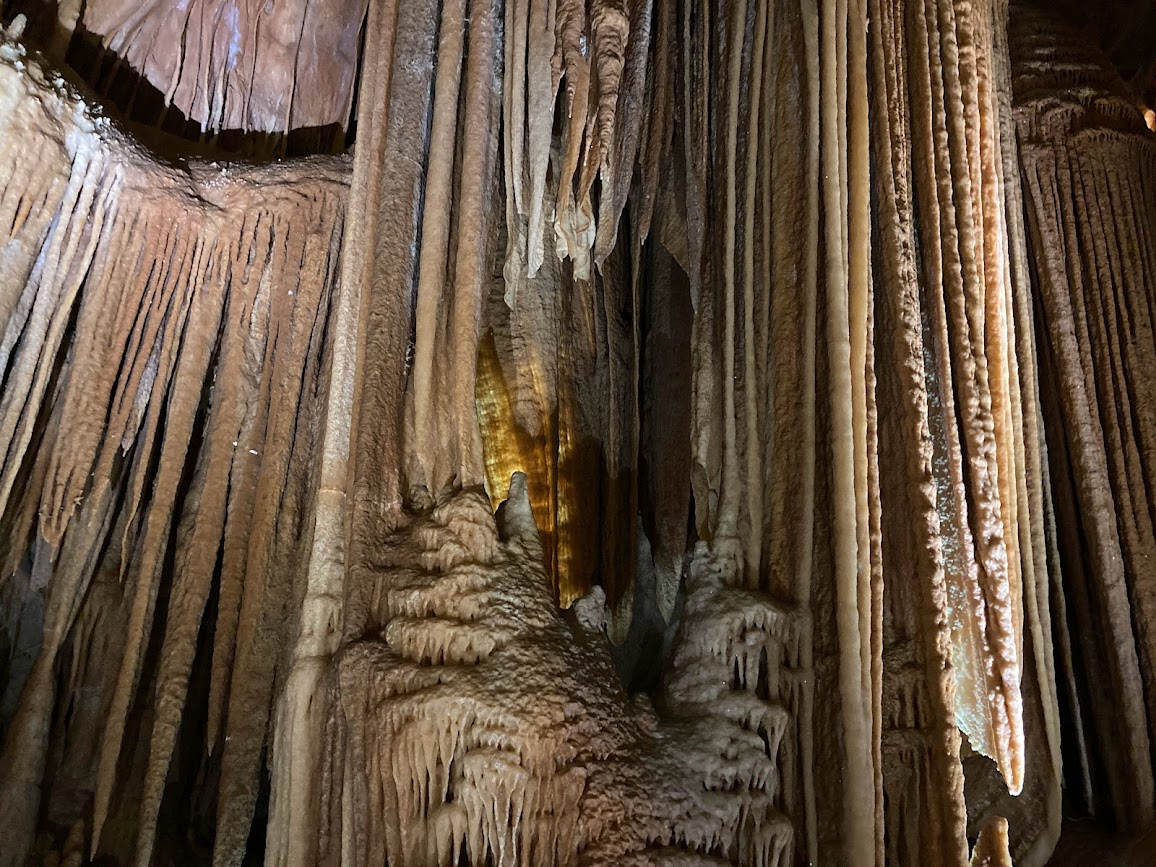
We took a hike at Wentworth Falls, where Darwin himself once walked. It’s part of the Great Dividing Range, but we learned that the mountains are actually “incised terrain,” formed when valleys were cut into a plateau, leaving “mountains” behind. We also drove to the Jenolan Caves and explored cavernous underground spaces bursting with crystal formations like stalactites, flowstone, and hollow soda straws. These lovely, fragile cave structures, or speleothems, are formed by the gradual deposition of dissolved minerals as water drips through a cave. Before we left, we saw an underground river with water so clear that I didn’t immediately realize I was looking at water at all.
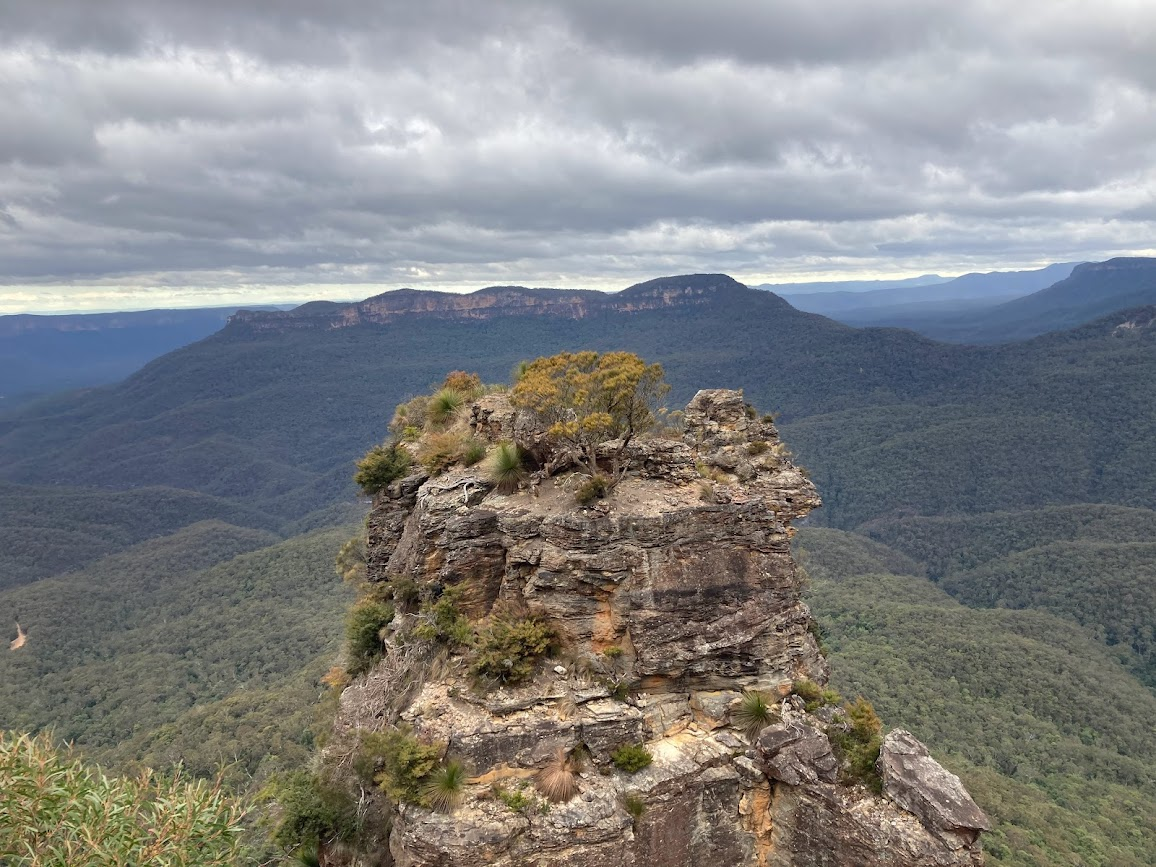
Another day in Katoomba, our group took a gorgeous hike through a eucalypt forest. Literally everywhere I looked in that forest, there was something extraordinary. Ancient tree ferns. Ruby-red sap seeping out of a tree trunk. The Three Sisters rock formation framed by the aptly named Blue Mountains. Towering eucalypt and turpentine trees. At the end of the hike, we rode the Scenic Railway, the steepest in the world. It was terrifying—awesome, but terrifying.
Next, we flew to the Northern Territory, where we checked into our hostel in Darwin. We were now in crocodile country, home to the world’s largest reptile: the saltwater or estuarine crocodile. We were instructed to avoid going in any body of water, saltwater or otherwise, unless it was specifically designated as safe for swimming. (The name “saltwater crocodile” is misleading—the crocodiles can inhabit fresh water as well, and they are extremely aggressive and dangerous.) It was very important to be crocwise.

The first few days in Darwin, we didn’t see any crocodiles, but there were birds seemingly everywhere. Varied triller, which I originally misidentified as the buff-sided robin until a local eBird reviewer emailed me and asked me to correct my eBird report. Rainbow bee-eater, remarkably common for a bird that looks too beautiful to be real. Peaceful dove. Blue-faced honeyeater. Australasian figbird.
We took a hike that went through a beautiful mangrove, where we learned that the term mangrove isn’t specific to any particular type of plant; it’s used to refer to many very different species that have all adapted to the same challenges, including salinity, changing tides, and nutrient-poor soil. There were crabs and snails and birds—so many birds, some of which I still haven’t identified, like the group of black, crested birds with bright red inside their beaks.
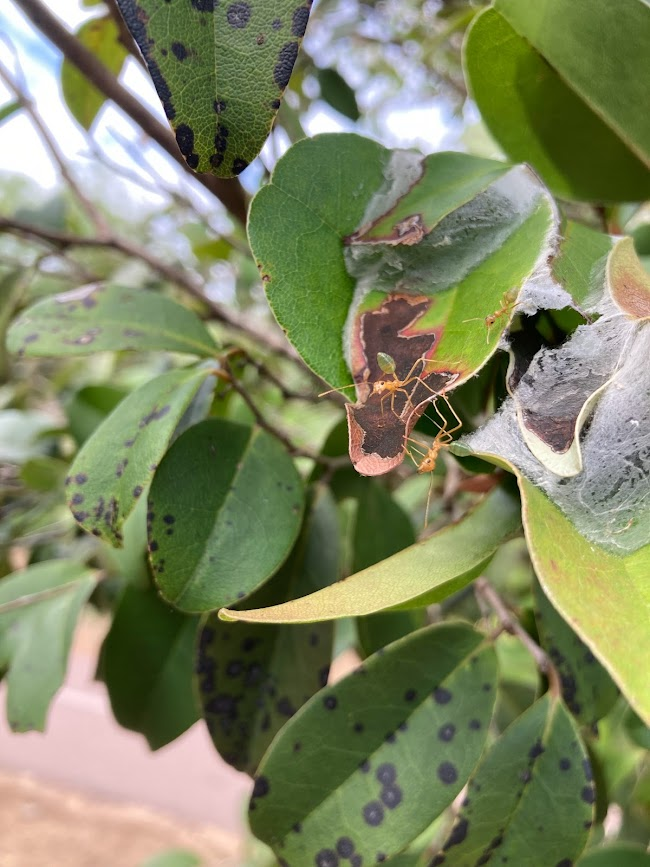
When we emerged from the mangrove, we came across a nest of green weaver ants. Their bright green abdomens are rich in ascorbic acid, and the ants have traditionally been used for purposes ranging from treating colds to making a sort of “lemonade” to stimulating milk production. Many of us were eager to taste the ants, though Glass warned us that they “bite vigorously.” Some of my classmates carefully held an ant with their fingers while giving the abdomen a quick lick. I, on the other hand, decided to let an ant crawl onto my notebook while I licked it so it couldn’t bite my fingers. Clever, right? Well, it worked—the ant didn’t bite my fingers. It bit my tongue instead. “Vigorously.” Its mouthparts remained latched on even as I was spitting out ant parts onto the ground. I can’t blame it—I’d be upset, too, if a giant tried to lick me.
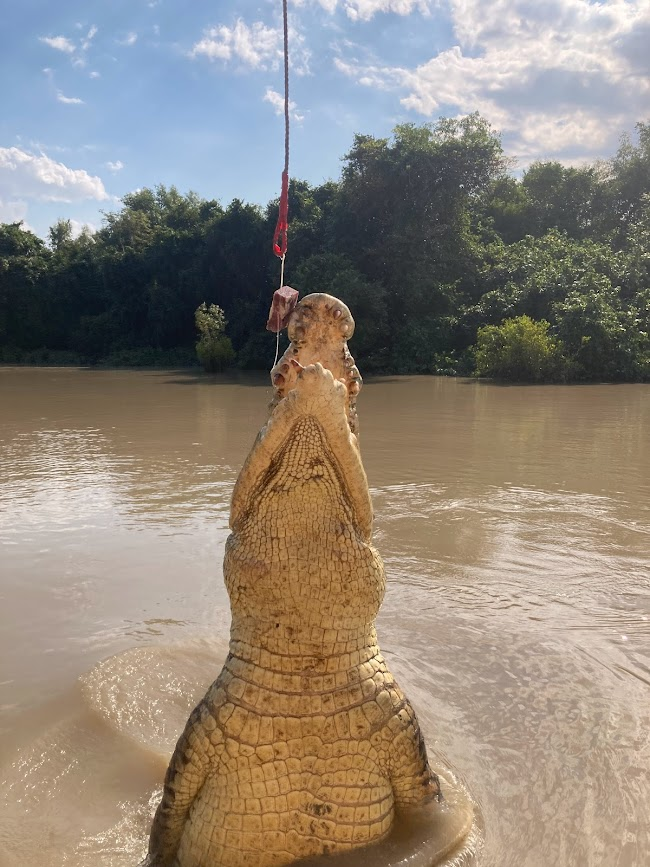
Before long, it was time for the jumping crocodile tour. We boarded a tour boat and floated down a seemingly peaceful river while our guide dangled hunks of meat from big fishing rods to bait the crocodiles to leap several feet out of the water and snap their jaws around the food. Their bite force, incidentally, is the highest of any living animal, up to 3700 pounds per square inch. Jumping is natural for the crocodiles—they hunt that way to snag animals like birds and wallabies that venture too close to the water. Being that close to enormous predators roused some deep, primeval fear in me. To a crocodile, I would make excellent prey. The jumping crocodile tour, needless to say, was very memorable. Our class later had a long and far-ranging discussion on the many types of ecotourism experiences we’d participated in and their costs, benefits, and ethical implications.
The next day, we left for a three-day camping trip in Kakadu and Litchfield National Parks. It was the dry season, and the weather was hot, dry, and sunny. We went hiking and snorkeling (in croc-free swimming holes), saw the breathtaking magnetic and cathedral termite mounds, and learned about geology and Aboriginal cultures. Some of the places we visited were sacred sites of the people who have inhabited the region for more than 65,000 years. One of the rock art paintings we were able to see was of a Tasmanian tiger, an animal that’s been completely extinct for close to a century and extinct in the Kakadu region for thousands of years. But right there on the wall was the preserved memory of a time when Tasmanian tigers still roamed the area.
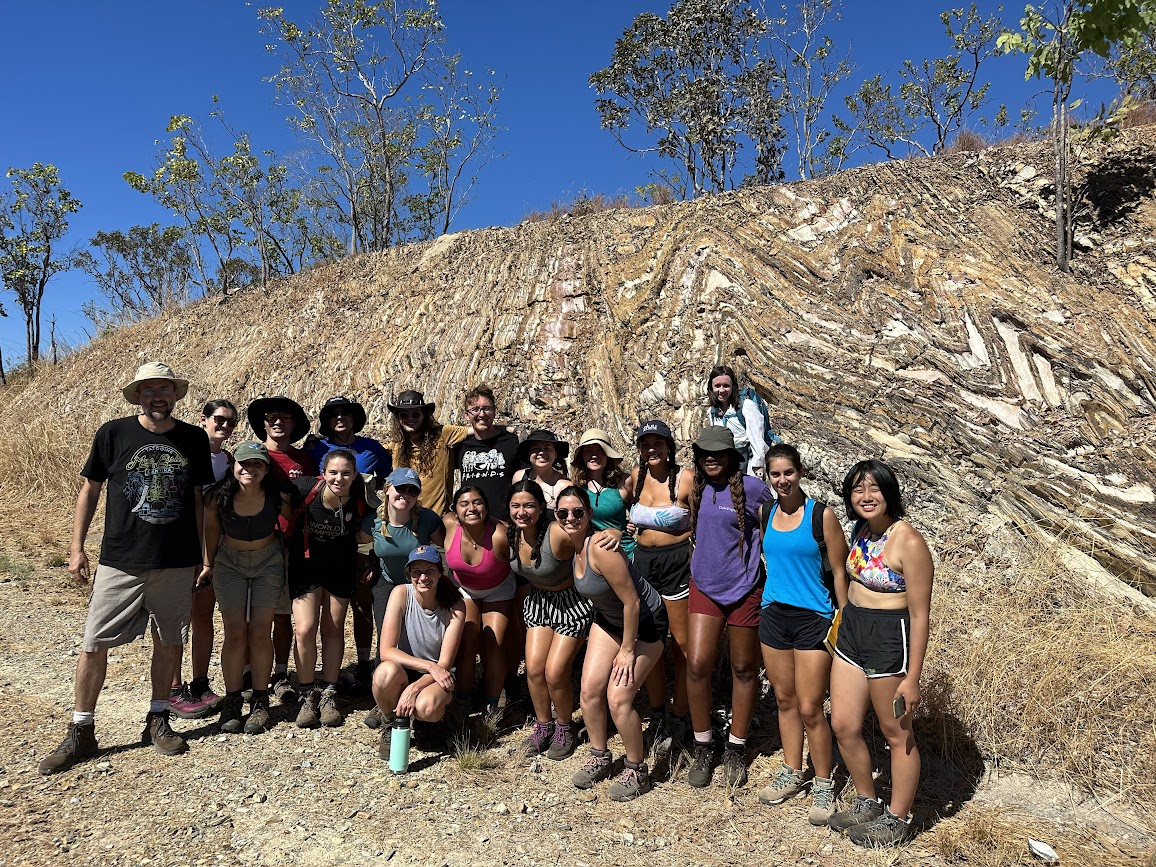
One of the coolest places we stopped was a rock cut-out along a highway. The stone was striped with zigzagging layers created when it was buried underground at a pressure high enough to fold solid rock. It was formed 1.9 billion years ago, when the earth was “a geologist’s dream,” according to Glass–relatively barren, with no soil, plants, or animals, just microscopic organisms and lots and lots of rock. I was touching 1.9 billion years of history.
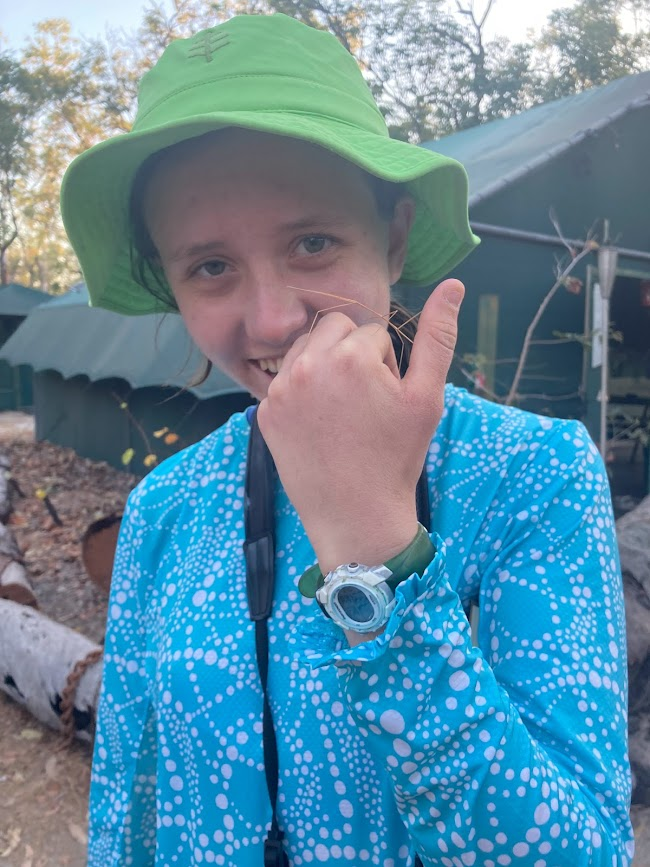
We spent the third night at a different campsite. Some of us spotted what seemed to be a large spider in the bathroom, but one of the tour guides informed me that it was actually just the shed skin of a huntsman spider, not the spider itself. I walked around camp introducing people to my “little friend,” but oddly enough, they didn’t seem as delighted as I was.
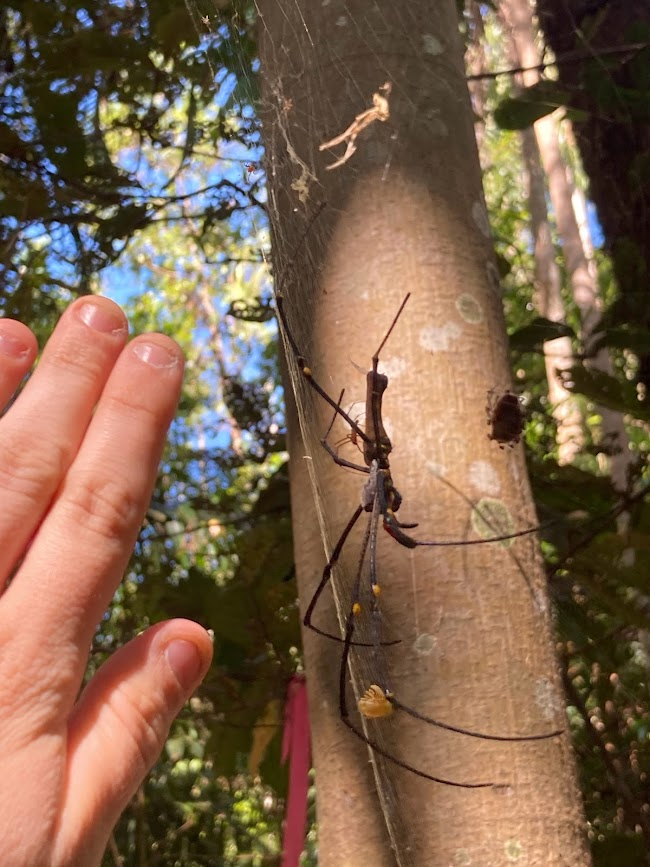
That night, while we were theoretically sleeping, periodic cacophonies of eerie, wailing screams reverberated through the air. My half-asleep brain was convinced they were from wallabies, but the sound actually came from a bird called the bush stone-curlew or bush thick-knee. The next morning, there was a gecko in the bathroom, and I wasn’t sure my day could possibly get any better. But later that day, we visited a fragment of an ancient rainforest, and there were giant fruit bats practically dripping from the canopy and giant golden orb weaver spider webs strung between trees, and I think that was even better than the bathroom gecko.
After departing Darwin, we headed to Cape Tribulation, where the Great Barrier Reef meets the Daintree Rainforest—believed to be the oldest rainforest on the planet. Some rainforests, Glass explained, exist because they’re near the equator. But the rainforests in Australia are remnants of ancient rainforests that developed when the continents were arranged very differently and Australia was considerably farther south. Australia’s climate has become more arid over time, but pockets of its ancient rainforests remain intact.
While we were on Cape Tribulation, we had the chance to snorkel on the Great Barrier Reef. It was overcast and very windy that day, and the small boat that took us out to the reef turned into a rollercoaster as it slid up and down waves. But windy or not, the reef was gorgeous. We saw sea turtles, a sea cucumber, a small shark, and fishes and corals in endless colors.
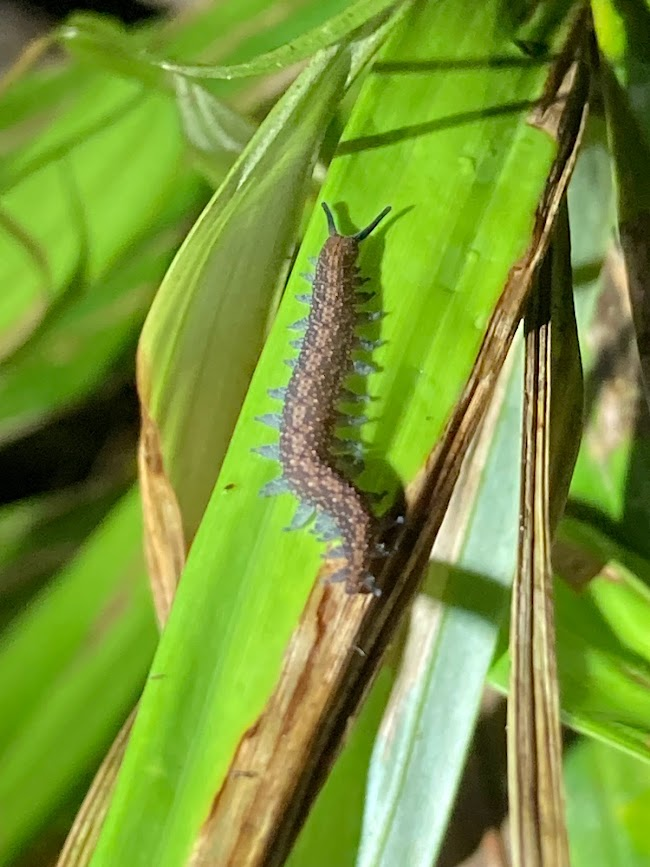
We also had the incredible opportunity to hike through the rainforest at night. Of all the amazing things we did, that may have been my favorite. There were huge crickets and spiders, thorny vines called wait-a-whiles (because you’ll be waiting a while if you get stuck on one), and flowering plants that looked like mushrooms. And partway along the boardwalk, Glass spotted a creature so unusual and elusive that he had never seen one before. This, he told us, was probably the rarest animal we’d seen on the whole trip. A velvet worm. It looked a bit like a caterpillar or a centipede at first glance, but velvet worms have an entire phylum all their own. (Caterpillars and centipedes share the Arthropoda phylum, along with all insects, spiders, crustaceans, and various others. Velvet worms are in the Onychophora phylum.) The ancestors of velvet worms are thought to represent a link between arthropods and segmented worms. They are ancient, unique, and rarely seen.
Just moments later, Glass announced another incredible find: a peppermint stick. I raced ahead to see it. Earlier that day, I’d seen signs about peppermint stick insects, which excrete a peppermint-scented liquid as a defense mechanism, and I’d been keeping my eyes peeled ever since. The creature had developed a sort of mythical status in my mind; I’d been fantasizing about seeing one but hadn’t actually expected to. But there it was, right in front of us, large and stick-like, its color a blue-green so bright that it almost seemed to glow.
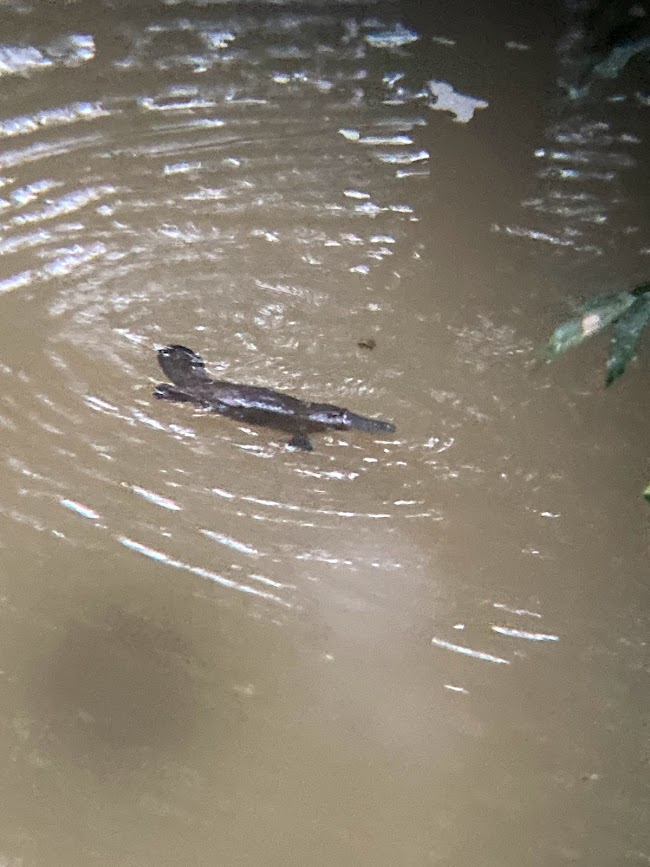
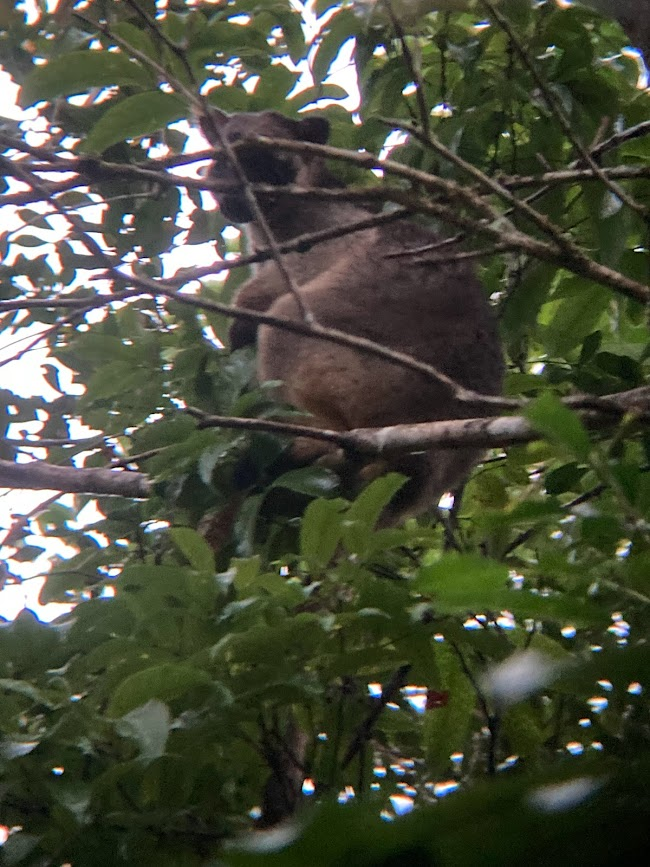
In Yungaburra, our next-to-last stop, we saw enormous fig trees and gorgeous waterfalls. On our last morning, several of us left the motel around dawn and walked to a nearby trail along a river in search of the platypus and the tree kangaroo, an arboreal kangaroo species. We found both. It was a fitting almost-ending to our trip. Both platypuses and kangaroos seem so iconically Australian. The platypuses slipped in and out of the water, their dark bodies visible even in the low light. The tree kangaroo watched us silently from its perch above us and then slowly began to move elsewhere.
Before long, it was time to go home. We spent a couple days in Cairns first, where I saw a shiny, emerald green beetle and a tree positively full of squawking lorikeets. Even in the city, there were bright and beautiful animals. In places like the ones we visited, it is easy to find awe and wonder and beauty everywhere you look. But there are endless treasures here, too, fascinating and beautiful sights that we walk past every day, like the way spiderwebs turn silver in the sunlight, or the gray catbird that eats bright red magnolia fruits in the courtyard in front of my dorm window, or the tiny, bluish purple flowers on the Al Buehler Trail, soft and fuzzy and damp when I brushed my face against them. Duke in Australia was an unforgettable adventure. It was also a reminder to step out of the human bubble and immerse myself in the worlds of other living things—whether here or across the globe.
Post by Sophie Cox, Class of 2025