Following the people and events that make up the research community at Duke

Students exploring the Innovation Co-Lab

Category: Statistics Page 3 of 5

Becoming the First: Nick Carnes

Editor’s Note: In the “Becoming the First” series,  first-generation college student and Rubenstein Scholar Lydia Goff explores the experiences of Duke researchers who were the first in their families to attend college.
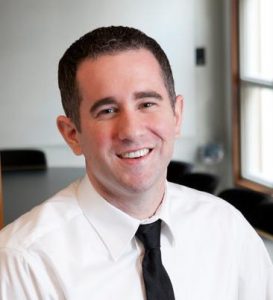
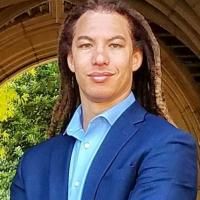
A portrait of Duke Professor Nick Carnes

Nick Carnes

Should we care that we are governed by professionals and millionaires? This is one of the questions Nick Carnes, an assistant professor in the Sanford School of Public Policy, seeks to answer with his research. He explores unequal social class representation in the political process and how it affects policy making. But do any real differences even exist between politicians from lower socioeconomic classes and those from the upper classes? Carnes believes they do, not only because of his research but also because of his personal experiences.

When Carnes entered Princeton University as a political science graduate student, he was the only member of his cohort who had done restaurant, construction or factory work. While obtaining his undergraduate degree from the University of Tulsa, he worked twenty hours a week and during the summer clocked in at sixty to seventy hours a week between two jobs. He considered himself and his classmates “similar on paper,” just like how politicians from a variety of socioeconomic classes can also appear comparable. However, Carnes noticed that he approached some problems differently than his classmates and wondered why. After attributing his distinct approach to his working class background, without the benefits of established college graduate family members (his mother did go to college while he was growing up), he began developing his current research interests.

Carnes considers “challenging the negative stereotypes about working class people” the most important aspect of his research. When he entered college, his first meeting with his advisor was filled with confusion as he tried to decipher what a syllabus was. While his working class status did restrict his knowledge of college norms, he overcame these limitations. He is now a researcher, writer, and professor who considers his job “the best in the world” and whose own story proves that working class individuals can conquer positions more often inhabited by the experienced. As Carnes states, “There’s no good reason to not have working class people in office.” His research seeks to reinforce that.

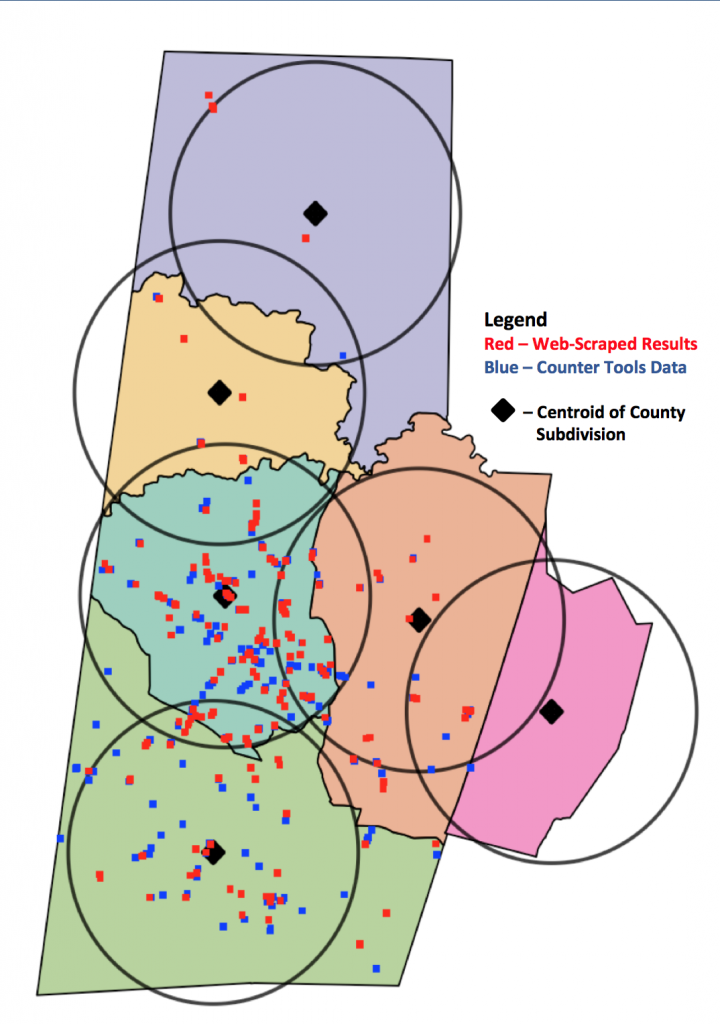
His biggest challenge is that the data he needs to analyze does not exist in a well-documented manner. Much of his research involves gathering data so that he can generate results. His published book, White-Collar Government: The Hidden Role of Class in Economic Policy Making, and his book coming out in September, The Cash Ceiling: Why Only the Rich Run for Office–and What We Can Do About It, contain the data and results he has produced. Presently, he is beginning a project on transnational governments because “cash ceilings exist in every advanced democracy.” Carnes’ research proves we should care that professionals and millionaires run our government. Through his story, he exemplifies that students who come from families without generations of college graduates can still succeed.    


Post by Lydia Goff


What is a Model?

When you think of the word “model,” what do you think?

As an Economics major, 
the first thing that comes to my mind is a statistical model, modeling phenomena such as the effect of class size on student test scores. A
car connoisseur’s mind might go straight to a model of their favorite vintage Aston
Martin. Someone else studying fashion even might imagine a runway model. The point is, the term “model” is used in popular discourse incredibly frequently, but are we even sure what it implies?

Annabel Wharton, a professor of Art, Art History, and Visual Studies at Duke, gave a talk entitled “Defining Models” at the Visualization Friday Forum. The forum is a place “for faculty, staff and students from across the university (and beyond Duke) to share their research involving the development and/or application of visualization methodologies.” Wharton’s goal was to answer the complex question, “what is a model?”

Wharton began the talk by defining the term “model,” knowing that it can often times be rather ambiguous. She stated the observation that models are “a prolific class of things,” from architectural models, to video game models, to runway models. Some of these types of things seem unrelated, but Wharton, throughout her talk, pointed out the similarities between them and ultimately tied them together as all being models.

The word “model” itself has become a heavily loaded term. According to Wharton, the dictionary definition of “model” is 9 columns of text in length. Wharton then stressed that a model “is an autonomous agent.” This implies that models must be independent of the world and from theory, as well as being independent of their makers and consumers. For example, architecture, after it is built, becomes independent of its architect.

Next, Wharton outlined different ways to model. They include modeling iconically, in which the model resembles the actual thing, such as how the video game Assassins Creed models historical architecture. Another way to model is indexically, in which parts of the model are always ordered the same, such as the order of utensils at a traditional place setting. The final way to model is symbolically, in which a model symbolizes the mechanism of what it is modeling, such as in a mathematical equation.

Wharton then discussed the difference between a “strong model” and a “weak model.” A strong model is defined as a model that determines its weak object, such as an architect’s model or a runway model. On the other hand, a “weak model” is a copy that is always less than its archetype, such as a toy car. These different classifications include examples we are all likely aware of, but weren’t able to explicitly classify or differentiate until now.

Wharton finally transitioned to discussing one of her favorite models of all time, a model of the Istanbul Hagia Sophia, a former Greek Orthodox Christian Church and later imperial mosque.(See Also: https://muze.gen.tr/muze-detay/ayasofya)

She detailed how the model that provides the best sense of the building without being there is found in a surprising place, an Assassin’s Creed video game. This model is not only very much resembles the actual Hagia Sophia, but is also an experiential and immersive model. Wharton joked that even better, the model allows explorers to avoid tourists, unlike in the actual Hagia Sophia.

Wharton described why the Assassin’s Creed model is a highly effective agent. Not only does the model closely resemble the actual architecture, but it also engages history by being surrounded by a historical fiction plot. Further, Wharton mentioned how the perceived freedom of the game is illusory, because the course of the game actually limits players’ autonomy with code and algorithms.

After Wharton’s talk, it’s clear that models are definitely “a prolific class of things.” My big takeaway is that so many thing in our everyday lives are models, even if we don’t classify them as such. Duke’s East Campus is a model of the University of Virginia’s campus, subtraction is a model of the loss of an entity, and an academic class is a model of an actual phenomenon in the world. Leaving my first Friday Visualization Forum, I am even more positive that models are powerful, and stretch so far beyond the statistical models in my Economics classes.


By Nina Cervantes

David Carlson: Engineering and Machine Learning for Better Medicine

How can we even begin to understand the human brain?  Can we predict the way people will respond to stress by looking at their brains?  Is it possible, even, to predict depression based on observations of the brain?

These answers will have to come from sets of data, too big for human minds to work with on our own. We need mechanical minds for this task.

Machine learning algorithms can analyze this data much faster than a human could, finding patterns in the data that could take a team of researchers far longer to discover. It’s just like how we can travel so much faster by car or by plane than we could ever walk without the help of technology.

David Carlson Duke

David Carlson in his Duke office.

I had the opportunity to speak to David Carlson, an assistant professor of Civil and Environmental Engineering with a dual appointment at the Department of Biostatistics and Bioinformatics at Duke University.  Through machine learning algorithms, Carlson is connecting researchers across campus, from doctors to statisticians to engineers, creating a truly interdisciplinary research environment around these tools.

Carlson specializes in explainable machine learning: algorithms with inner workings comprehensible by humans. Most deep machine learning today exists in a “black box” — the decisions made by the algorithm are hidden behind layers of reasoning that give it incredible predictive power but make it hard for researchers to understand the “why” and the “how” behind the results. The transparent algorithms used by Carlson offer a way to capture some of the predictive power of machine learning without sacrificing our understanding of what they’re doing.

In his most recent research, Carlson collaborated with Dr. Kafui Dzirasa, associate professor of psychiatry and behavioral sciences and assistant professor in neurobiology and neurosurgery, on the effects of stress on the brains of mice, trying to understand the underlying causes of depression.

“What’s happening in neuroscience is the amount of data we’re sorting through is growing rapidly, and it’s really beginning to outstrip our ability to use classical tools,” Carlson says. “A lot of these classical tools made a lot more sense when you had these small data sets, but now we’re talking about this canonically overused word, Big Data”

With machine learning algorithms, it’s easier than ever to find trends in these huge sets of data.  In his most recent study, Carlson and his fellow researchers could find patterns tied to stress and even to how susceptible a mouse was to depression. By continuing this project and looking at new ways to investigate the brain and check their results, Carlson hopes to help improve treatments for depression in the future.

In addition to his ongoing research into depression, Carlson has brought machine learning to a number of other collaborations with the medical center, including research into autism and patient care for diabetes. When there’s too much data for the old ways of data analysis, machine learning can step in, and Carlson sees potential in harnessing this growing technology to improve health and care in the medical field.

“What’s incredibly exciting is the opportunities at the intersection of engineering and medicine,” he said. “I think there’s a lot of opportunities to combine what’s happening in the engineering school and also what’s happening at the medical center to try to create ways of better treating people and coming up with better ways for making people healthier.”

Guest Post by Thomas Yang, a junior at North Carolina School of Math and Science.

Generating Winning Sports Headlines

What if there were a scientific way to come up with the most interesting sports headlines? With the development of computational journalism, this could be possible very soon.

Dr. Jun Yang is a database and data-intensive computing researcher and professor of Computer Science at Duke. One of his latest projects is computational journalism, in which he and other computer science researchers are considering how they can contribute to journalism with new technological advances and the ever-increasing availability of data.

An exciting and very relevant part of his project is based on raw data from Duke men’s basketball games. With computational journalism, Yang and his team of researchers have been able to generate diverse player or team factoids using the statistics of the games.

Grayson Allen headed for the hoop.

Grayson Allen headed for the hoop.

An example factoid might be that, in the first 8 games of this season, Duke has won 100% of its games when Grayson Allen has scored over 20 points. While this fact is obvious, since Duke is undefeated so far this season, Yang’s programs will also be able to generate very obscure factoids about each and every player that could lead to unique and unprecedented headlines.

While these statistics relating player and team success can only imply correlation, and not necessarily causation, they definitely have potential to be eye-catching sports headlines.

Extracting factoids hasn’t been a particularly challenging part of the project, but developing heuristics to choose which factoids are the most relevant and usable has been more difficult.

Developing these heuristics so far has involved developing scoring criteria based on what is intuitively impressive to the researcher. Another possible measure of evaluating the strength of a factoid is ranking the types of headlines that are most viewed. Using this method, heuristics could, in theory, be based on past successes and less on one researcher’s human intuition.

Something else to consider is which types of factoids are more powerful. For example, what’s better: a bolder claim in a shorter period of time, or a less bold claim but over many games or even seasons?

The ideal of this project is to continue to analyze data from the Duke men’s basketball team, generate interesting factoids, and put them on a public website about 10-15 minutes after the game.

Looking forward, computational journalism has huge potential for Duke men’s basketball, sports in general, and even for generating other news factoids. Even further, computational journalism and its scientific methodology might lead to the ability to quickly fact-check political claims.

Right now, however, it is fascinating to know that computer science has the potential to touch our lives in some pretty unexpected ways. As our current men’s basketball beginning-of-season winning streak continues, who knows what unprecedented factoids Jun Yang and his team are coming up with.

By Nina Cervantes

Who Gets Sick and Why?

During his presentation as part of the Chautauqua lecture series, Duke sociologist Dr. Tyson Brown explained his research exploring the ways racial inequalities affect a person’s health later in life. His project mainly looks at the Baby Boomer generation, Americans born between 1946 and 1964.

With incredible increases in life expectancy, from 47 years in 1900 to 79 today, elderly people are beginning to form a larger percentage of the population. However among black people, the average life expectancy is three and a half years shorter.

“Many of you probably do not think that three and half years is a lot,” Brown said. “But imagine how much less time that is with your family and loved ones. In the end, I think all of us agree we want those extra three and a half years.”

Not only does the black population in America have shorter lives on average but they also tend to have sicker lives with higher blood pressures, greater chances of stroke, and higher probability of diabetes. In total, the number of deaths that would be prevented if African-American people had the same life expectancy as white people is 880,000 over a nine-year span. Now, the question Brown has challenged himself with is “Why does this discrepancy occur?”

Brown said he first concluded that health habits and behaviors do not create this life expectancy gap because white and black people have similar rates of smoking, drinking, and illegal drug use. He then decided to explore socioeconomic status. He discovered that as education increases, mortality decreases. And as income increases, self-rated health increases. He said that for every dollar a white person makes, a black person makes 59 cents.

This inequality in income points to the possible cause for the racial inequality in health, he said.  Additionally, in terms of wealth instead of income, a black person has 6 cents compared to the white person’s dollar. Possibly even more concerning than this inconsistency is the fact that it has gotten worse, not better, over time. Before the 2006 recession, blacks had 10-12 cents of wealth for every white person’s dollar.

Brown believes that this financial stress forms one of many stressors in black lives including chronic stressors, everyday discrimination, traumatic events, and neighborhood disorder which affect their health.

Over time, these stressors create something called physiological dysregulation, otherwise known as wear and tear, through repeated activation of  the stress response, he said. Recognition of the prevalence of these stressors in black lives has lead to Brown’s next focus on the extent of the effect of stressors on health. For his data, he uses the Health and Retirement Study and self-rated health (proven to predict mortality better than physician evaluations). For his methods, he employs structural equation modeling. Racial inequalities in socioeconomic resources, stressors and biomarkers of physiological dysregulation collectively explain 87% of the health gap with any number of causes capable of filling the remaining percentage.

Brown said his next steps include using longitudinal and macro-level data on structural inequality to understand how social inequalities “get under the skin” over a person’s lifetime. He suggests that the next steps for society, organizations, and the government to decrease this racial discrepancy rest in changing economic policy, increasing wages, guaranteeing work, and reducing residential segregation.

Post by Lydia Goff

New Blogger Daniel Egitto: Freshman and Aspiring Journalist

Hi, I’m Daniel Egitto, a freshman at Duke with an intended major in English. I’m from Florida, and I spent the better part of my childhood growing up in some small, quiet suburbs surrounded by pretty much nothing but farms, rivers and untouched forest for acres and acres around. Out where I lived, it was nearly impossible to ever get more than a few miles from the wilderness that still covers a huge chunk of Florida today. Mazes of pine and oak forests made up my backyard, crisscrossed with bubbling springs and dotted with the occasional deer, coyote or alligator peeking out of the trees. It was there in those Florida woods, kayaking and hiking through some of America’s last wild places, that I first fell in love with the natural world and the conservationist issues facing our country today.

Daniel Egitto in a tree

Incoming freshman Daniel Egitto is pursuing an English major for a future career in journalism.

Because despite its treasure trove of both scientific and recreational gems, Florida has a truly terrible history of protecting natural heritage. Governor Rick Scott, for example, brought in a gag rule on the words “climate change” appearing in any state environmental document, while at the same time the well-being of those springs I came to know and love in my childhood has faced rising challenges due to unsustainable farming practices and water use policies. An unacceptable number of Americans are still unaware of both the struggles and opportunities this country’s biodiversity has always offered, and because of this I have come to develop a passion for both science education and topical journalism in general.

In high school my experiences led me to reach out into my community, engaging with children about basic scientific concepts at a local robotics camp and “Science Saturdays” series. I also became heavily involved with my school’s newly-founded newspaper, where I helped shift its focus onto important yet poorly-publicized struggles of both our society and our world as a whole.

As I enter into my first year on Duke campus, I hope to work with the Duke Research Blog to further both my interests and my goals. I’m currently pursuing a future career in journalism, and by working with Duke Research I hope we can all help nurture a more informed and understanding world.

In addition to my work with this blog, I also intend to get involved with the Chronicle and Me Too Monologues on campus.

Pinpointing Where Durham’s Nicotine Addicts Get Their Fix

DURHAM, N.C. — It’s been five years since Durham expanded its smoking ban beyond bars and restaurants to include public parks, bus stops, even sidewalks.

While smoking in the state overall may be down, 19 percent of North Carolinians still light up, particularly the poor and those without a high school or college diploma.

Among North Carolina teens, consumption of electronic cigarettes in particular more than doubled between 2013 and 2015.

Now, new maps created by students in the Data+ summer research program show where nicotine addicts can get their fix.

Studies suggest that tobacco retailers are disproportionately located in low-income neighborhoods.

Living in a neighborhood with easy access to stores that sell tobacco makes it easier to start young and harder to quit.

The end result is that smoking, secondhand smoke exposure, and smoking-related diseases such as lung cancer, are concentrated among the most socially disadvantaged communities.

If you’re poor and lack a high school or college diploma, you’re more likely to live near a store that sells tobacco.

If you’re poor and lack a high school or college diploma, you’re more likely to live near a store that sells tobacco. Photo from Pixabay.

Where stores that sell tobacco are located matters for health, but for many states such data are hard to come by, said Duke statistics major James Wang.

Tobacco products bring in more than a third of in-store sales revenue at U.S. convenience stores — more than food, beverages, candy, snacks or beer. Despite big profits, more than a dozen states don’t require businesses to get a special license or permit to sell tobacco. North Carolina is one of them.

For these states, there is no convenient spreadsheet from the local licensing agency identifying all the businesses that sell tobacco, said Duke undergraduate Nikhil Pulimood. Previous attempts to collect such data in Virginia involved searching for tobacco retail stores by car.

“They had people physically drive across every single road in the state to collect the data. It took three years,” said team member and Duke undergraduate Felicia Chen.

Led by UNC PhD student in epidemiology Mike Dolan Fliss, the Duke team tried to come up with an easier way.

Instead of collecting data on the ground, they wrote an automated web-crawler program to extract the data from the Yellow Pages websites, using a technique called Web scraping.

By telling the software the type of business and location, they were able to create a database that included the names, addresses, phone numbers and other information for 266 potential tobacco retailers in Durham County and more than 15,500 statewide, including chains such as Family Fare, Circle K and others.

Map showing the locations of tobacco retail stores in Durham County, North Carolina.

Map showing the locations of tobacco retail stores in Durham County, North Carolina.

When they compared their web-scraped data with a pre-existing dataset for Durham County, compiled by a nonprofit called Counter Tools, hundreds of previously hidden retailers emerged on the map.

To determine which stores actually sold tobacco, they fed a computer algorithm data from more than 19,000 businesses outside North Carolina so it could learn how to distinguish say, convenience stores from grocery stores. When the algorithm received store names from North Carolina, it predicted tobacco retailers correctly 85 percent of the time.

“For example we could predict that if a store has the word “7-Eleven” in it, it probably sells tobacco,” Chen said.

As a final step, they also crosschecked their results by paying people a small fee to search for the stores online to verify that they exist, and call them to ask if they actually sell tobacco, using a crowdsourcing service called Amazon Mechanical Turk.

Ultimately, the team hopes their methods will help map the more than 336,000 tobacco retailers nationwide.

“With a complete dataset for tobacco retailers around the nation, public health experts will be able to see where tobacco retailers are located relative to parks and schools, and how store density changes from one neighborhood to another,” Wang said.

The team presented their work at the Data+ Final Symposium on July 28 in Gross Hall.

Data+ is sponsored by Bass Connections, the Information Initiative at Duke, the Social Science Research Institute, the departments of mathematics and statistical science and MEDx. This project team was also supported by Counter Tools, a non-profit based in Carrboro, NC.

Writing by Robin Smith; video by Lauren Mueller and Summer Dunsmore

Data Geeks Go Head to Head

For North Carolina college students, “big data” is becoming a big deal. The proof: signups for DataFest, a 48-hour number-crunching competition held at Duke last weekend, set a record for the third time in a row this year.

DataFest 2017

More than 350 data geeks swarmed Bostock Library this weekend for a 48-hour number-crunching competition called DataFest. Photo by Loreanne Oh, Duke University.

Expected turnout was so high that event organizer and Duke statistics professor Mine Cetinkaya-Rundel was even required by state fire code to sign up for “crowd manager” safety training — her certificate of completion is still proudly displayed on her Twitter feed.

Nearly 350 students from 10 schools across North Carolina, California and elsewhere flocked to Duke’s West Campus from Friday, March 31 to Sunday, April 2 to compete in the annual event.

Teams of two to five students worked around the clock over the weekend to make sense of a single real-world data set. “It’s an incredible opportunity to apply the modeling and computing skills we learn in class to actual business problems,” said Duke junior Angie Shen, who participated in DataFest for the second time this year.

The surprise dataset was revealed Friday night. Just taming it into a form that could be analyzed was a challenge. Containing millions of data points from an online booking site, it was too large to open in Excel. “It was bigger than anything I’ve worked with before,” said NC State statistics major Michael Burton.

DataFest 2017

The mystery data set was revealed Friday night in Gross Hall. Photo by Loreanne Oh.

Because of its size, even simple procedures took a long time to run. “The dataset was so large that we actually spent the first half of the competition fixing our crushed software and did not arrive at any concrete finding until late afternoon on Saturday,” said Duke junior Tianlin Duan.

The organizers of DataFest don’t specify research questions in advance. Participants are given free rein to analyze the data however they choose.

“We were overwhelmed with the possibilities. There was so much data and so little time,” said NCSU psychology major Chandani Kumar.

“While for the most part data analysis was decided by our teachers before now, this time we had to make all of the decisions ourselves,” said Kumar’s teammate Aleksey Fayuk, a statistics major at NCSU.

As a result, these budding data scientists don’t just write code. They form theories, find patterns, test hunches. Before the weekend is over they also visualize their findings, make recommendations and communicate them to stakeholders.

This year’s participants came from more than 10 schools, including Duke, UNC, NC State and North Carolina A&T. Students from UC Davis and UC Berkeley also made the trek. Photo by Loreanne Oh.

“The most memorable moment was when we finally got our model to start generating predictions,” said Duke neuroscience and computer science double major Luke Farrell. “It was really exciting to see all of our work come together a few hours before the presentations were due.”

Consultants are available throughout the weekend to help with any questions participants might have. Recruiters from both start-ups and well-established companies were also on site for participants looking to network or share their resumes.

“Even as late as 11 p.m. on Saturday we were still able to find a professor from the Duke statistics department at the Edge to help us,” said Duke junior Yuqi Yun, whose team presented their results in a winning interactive visualization. “The organizers treat the event not merely as a contest but more of a learning experience for everyone.”

Caffeine was critical. “By 3 a.m. on Sunday morning, we ended initial analysis with what we had, hoped for the best, and went for a five-hour sleep in the library,” said NCSU’s Fayuk, whose team DataWolves went on to win best use of outside data.

By Sunday afternoon, every surface of The Edge in Bostock Library was littered with coffee cups, laptops, nacho crumbs, pizza boxes and candy wrappers. White boards were covered in scribbles from late-night brainstorming sessions.

“My team encouraged everyone to contribute ideas. I loved how everyone was treated as a valuable team member,” said Duke computer science and political science major Pim Chuaylua. She decided to sign up when a friend asked if she wanted to join their team. “I was hesitant at first because I’m the only non-stats major in the team, but I encouraged myself to get out of my comfort zone,” Chuaylua said.

“I learned so much from everyone since we all have different expertise and skills that we contributed to the discussion,” said Shen, whose teammates were majors in statistics, computer science and engineering. Students majoring in math, economics and biology were also well represented.

At the end, each team was allowed four minutes and at most three slides to present their findings to a panel of judges. Prizes were awarded in several categories, including “best insight,” “best visualization” and “best use of outside data.”

Duke is among more than 30 schools hosting similar events this year, coordinated by the American Statistical Association (ASA). The winning presentations and mystery data source will be posted on the DataFest website in May after all events are over.

The registration deadline for the next Duke DataFest will be March 2018.

DataFest 2017

Bleary-eyed contestants pose for a group photo at Duke DataFest 2017. Photo by Loreanne Oh.

s200_robin.smith

Post by Robin Smith

Young Scientists, Making the Rounds

“Can you make a photosynthetic human?!” an 8th grader enthusiastically asks me while staring at a tiny fern in a jar.

He’s not the only one who asked me that either — another student asked if Superman was a plant, since he gets his power from the sun.

These aren’t the normal questions I get about my research as a Biology PhD candidate studying how plants get nutrients, but they were perfect for the day’s activity –A science round robin with Durham eighth-graders.

Biology grad student Leslie Slota showing Durham 8th graders some fun science.

After seeing a post under #scicomm on Twitter describing a public engagement activity for scientists, I put together a group of Duke graduate scientists to visit local middle schools and share our science with kids. We had students from biomedical engineering, physics, developmental biology, statistics, and many others — a pretty diverse range of sciences.

With help from David Stein at the Duke-Durham Neighborhood Partnership, we made connections with science teachers at the Durham School of the Arts and Lakewood Montessori school, and the event was in motion!

The outreach activity we developed works like speed dating, where people pair up, talk for 3-5 mins, and then rotate. We started out calling it “Science Speed Dating,” but for a middle school audience, we thought “Science Round-Robin” was more appropriate. Typically, a round-robin is a tournament where every team plays each of the other teams. So, every middle schooler got to meet each of us graduate students and talk to us about what we do.

The topics ranged from growing back limbs and mapping the brain, to using math to choose medicines and manipulating the different states of matter.

The kids were really excited for our visit, and kept asking their teachers for the inside scoop on what we did.

After much anticipation, and a little training and practice with Jory Weintraub from the Science & Society Initiative, two groups of 7-12 graduate students armed themselves with photos, animals, plants, and activities related to our work and went to visit these science classes full of eager students.

First-year MGM grad student Tulika Singh (top right) brought cardboard props to show students how antibodies match up with cell receptors.

“The kids really enjoyed it!” said Alex LeMay, middle- and high-school science teacher at the Durham School of the Arts. “They also mentioned that the grad students were really good at explaining ideas in a simple way, while still not talking down to them.”

That’s the ultimate trick with science communication: simplifying what we do, but not talking to people like they’re stupid.

I’m sure you’ve heard the old saying, “dumb it down.” But it really doesn’t work that way. These kids were bright, and often we found them asking questions we’re actively researching in our work. We don’t need to talk down to them, we just need to talk to them without all of the exclusive trappings of science. That was one thing the grad students picked up on too.

“It’s really useful to take a step back from the minutia of our projects and look at the big picture,” said Shannon McNulty, a PhD candidate in Molecular Genetics and Microbiology.

The kids also loved the enthusiasm we showed for our work! That made a big difference in whether they were interested in learning more and asking questions. Take note, fellow scientists: share your enthusiasm for what you do, it’s contagious!

Another thing that worked really well was connecting with the students in a personal way. According to Ms. LeMay, “if the person seemed to like them, they wanted to learn more.” Several of the grad students would ask each student their names and what they were passionate about, or even talk about their own passions outside of their research, and these simple questions allowed the students to connect as people.

There was one girl who shared with me that she didn’t know what she wanted to do when she grew up, and I told her that’s exactly where I was when I was in 8th grade too. We then bonded over our mutual love of baking, and through that interaction she saw herself reflected in me a little bit; making a career in science seem like a possibility, which is especially important for a young girl with a growing interest in science.

Making the rounds in these science classrooms, we learned just as much from the students we spoke to as they did from us. Our lesson being: science outreach is a really rewarding way to spend our time, and who knows, maybe we’ll even spark someone who loves Superman to figure out how to make the first photosynthesizing super-person!

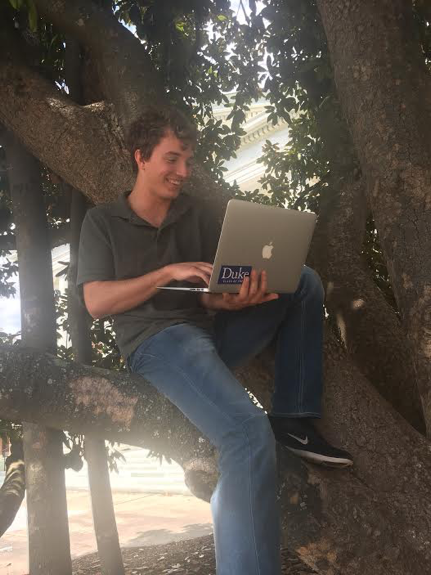
Guest post by Ariana Eily , PhD Candidate in Biology, shown sharing her floating ferns at left.


Would You Expect a 'Real Man' to Tweet "Cute" or Not?

There’s nothing cute about stereotypes, but as a species, we seem to struggle to live without them.

In a clever new study led by Jordan Carpenter, who is now a postdoctoral fellow at Duke, a University of Pennsylvania team of social psychologists and computer scientists figured out a way to test just how accurate our stereotypes about language use might be, using a huge collection of real tweets and a form of artificial intelligence called “natural language processing.”

Wordclouds show the words in tweets that raters mistakenly attributed to Female authors (left) or Males (right).

Word clouds show the words in tweets that raters mistakenly attributed to Female authors (left) or Males (right). The larger the word appears, the more often the raters were fooled by it. Word color indicates the frequency of the word; gray is least frequent, then blue, and dark red is the most frequent. <url> means they used a link in their tweet.

Starting with a data set that included the 140-character bon mots of more than 67,000 Twitter users, they figured out the actual characteristics of 3,000 of the authors. Then they sorted the authors into piles using four criteria – male v. female; liberal v. conservative; younger v. older; and education (no college degree, college degree, advanced degree).

A random set of 100 tweets by each author over 12 months was loaded into the crowd-sourcing website Amazon Mechanical Turk. Intertubes users were then invited to come in and judge what they perceived about the author one characteristic at a time, like age, gender, or education, for 2 cents per rating. Some folks just did one set, others tried to make a day’s wage.

The raters were best at guessing politics, age and gender. “Everybody was better than chance,” Carpenter said. When guessing at education, however, they were worse than chance.

Jordan Carpenter is a newly-arrived Duke postdoc working with Walter Sinnott-Armstrong in philosophy and brain science.

Jordan Carpenter is a newly-arrived Duke postdoc working with Walter Sinnott-Armstrong in philosophy and brain science.

“When they saw the word S*** [this is a family blog folks, work with us here] they most often thought the author didn’t have a college degree. But where they went wrong was they overestimated the importance of that word,” Carpenter said. Raters seemed to believe that a highly-educated person would never tweet the S-word or the F-word. Unfortunately, not true! “But it is a road to people thinking you’re not a Ph.D.,” Carpenter wisely counsels.

The raters were 75 percent correct on gender, by assuming women would be tweeting words like Love, Cute, Baby and My, interestingly enough. But they got tricked most often by assuming women would not be talking about News, Research or Ebola or that the guys would not be posting Love, Life or Wonderful.

Female authors were slightly more likely to be liberal in this sample of tweets, but not as much as the raters assumed. Conservatism was viewed by raters as a male trait. Again, generally true, but not as much as the raters believed.

Youthful authors were correctly perceived to be more likely to namedrop a @friend, or say Me and Like and a few variations on the F-bomb, but they could throw the raters for a loop by using Community, Our and Original.

And therein lies the social psychology takeaway from all this: “An accurate stereotype should be one with accurate social judgments of people,” but clearly every stereotype breaks down at some point, leading to “mistaken social judgement,” Carpenter said. Just how much stereotypes should be used or respected is a hot area of discussion within the field right now, he said.

The other value of the paper is that it developed an entirely new way to apply the tools of Big Data analysis to a social psychology question without having to invite a bunch of undergraduates into the lab with the lure of a Starbucks gift card. Using tweets stripped of their avatars or any other identifier ensured that the study was testing what people thought of just the words, nothing else, Carpenter said.

The paper is “Real Men Don’t Say “Cute”: Using Automatic Language Analysis To Isolate Inaccurate Aspects Of Stereotypes.”  You can see the paper in Social Psychology and Personality Science, if you have a university IP address and your library subscribes to Sage journals. Otherwise, here’s a press release from the journal. (DOI: 10.1177/1948550616671998 )

Karl Leif BatesPost by Karl Leif Bates

Page 3 of 5

Powered by WordPress & Theme by Anders Norén