

This visualization, created by James Moody and the team at the Duke Network Analysis Center, links faculty from across schools and departments who serve together on Ph.D. committees. An interactive version is available here.
When the next big breakthrough in cancer treatment is announced, no one will ask whether the researchers are pharmacologists, oncologists or cellular biologists – and chances are, the team will represent all three.
In the second annual Scholars@Duke Visualization Challenge, Duke students explored how scholars across campus are drawing from multiple academic disciplines to tackle big research questions.
“I’m often amazed at how gifted Duke faculty are and how they can have expertise in multiple fields, sometimes even fields that don’t seem to overlap,” said Julia Trimmer, Director of Faculty Data Systems and Analysis at Duke.
In last year’s challenge, students dug into Scholars@Duke publication data to explore how Duke researchers collaborate across campus. This year, they were provided with additional data on Ph.D. dissertation committees and asked to focus on how graduate education and scholarship are reaching across departmental boundaries.
“The idea was to see if certain units or disciplines contributed faculty committee members across disciplines or if there’s a lot of discipline ‘overlap.’” Trimmer said.
The winning visualization, created by graduate student Matthew Epland, examines how Ph.D. committees span different fields. In this interactive plot, each marker represents an academic department. The closer together markers are, the more likely it is that a faculty member from one department will serve on the committee of a student in the other department.
Epland says he was intrigued to see the tight-knit community of neuroscience-focused departments that span different schools, including psychology and neuroscience, neurobiology, neurology and psychiatry and behavioral Sciences. Not surprisingly, many of the faculty in these departments are members of the Duke Institute for Brain Sciences (DIBS).
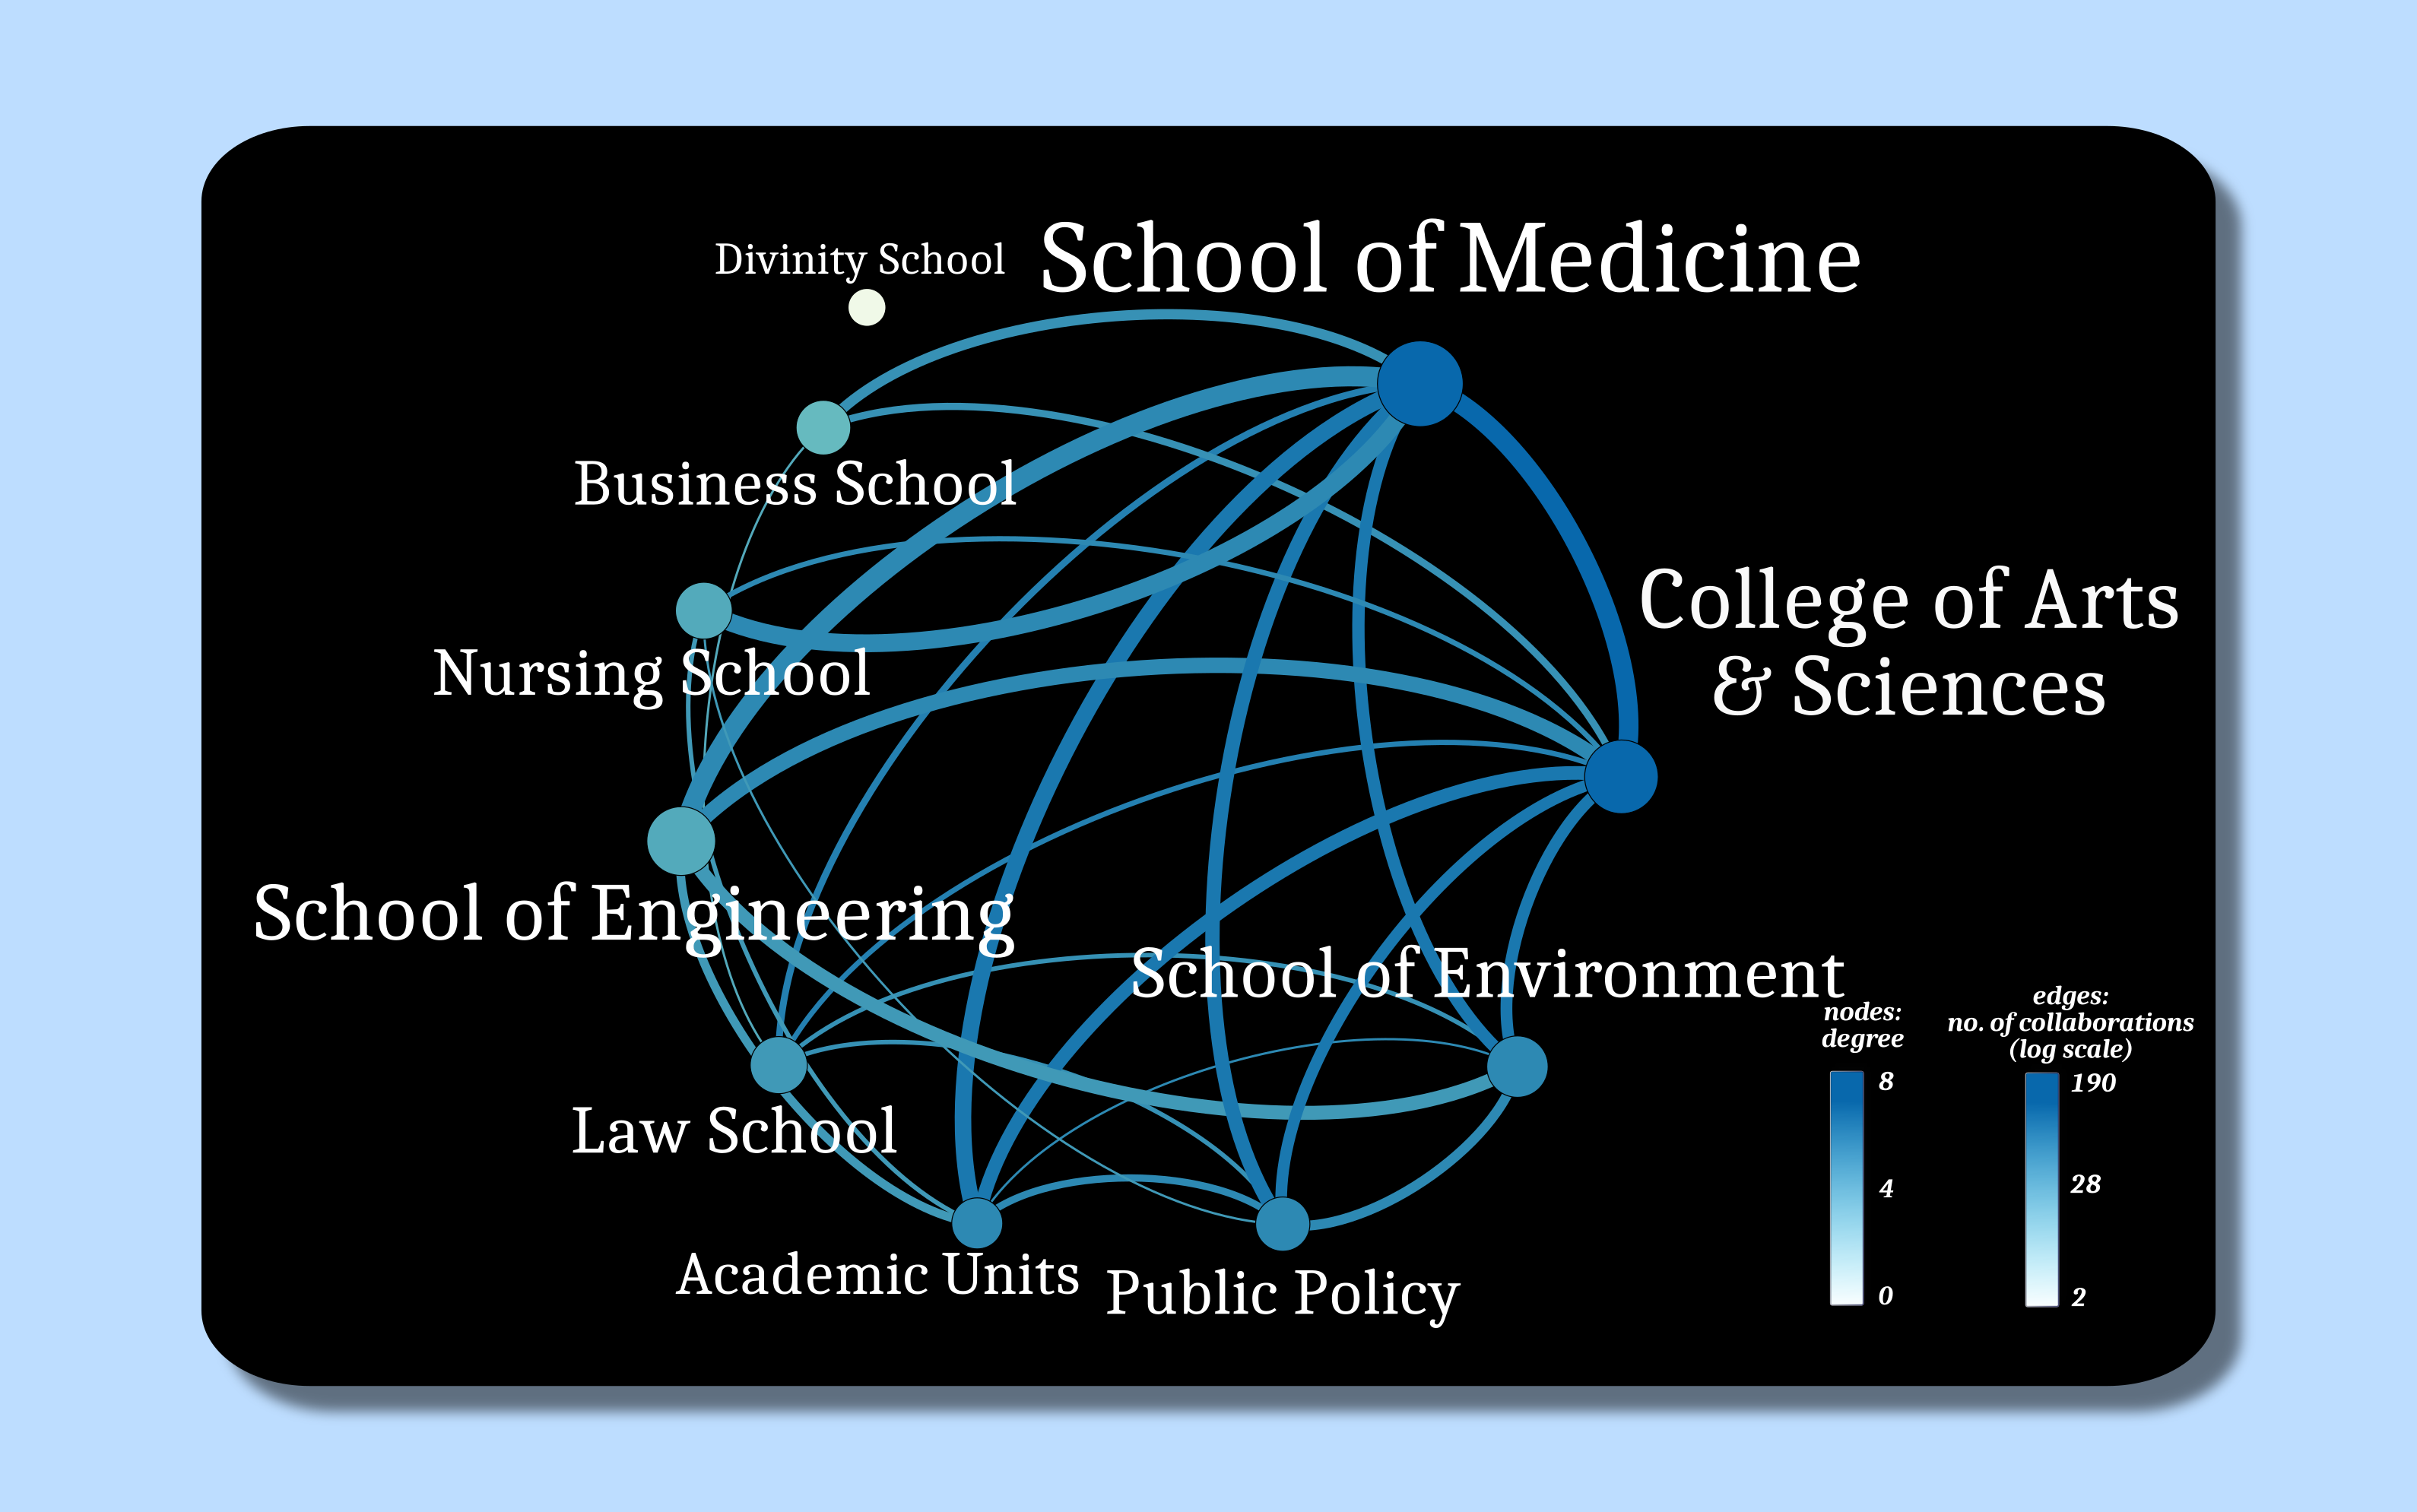
Aghil Abed Zadeh and Varda F. Hagh analyzed publication data to visualize the extent to which faculty at different Duke schools collaborate with one another. The size of each dot represents the number of publications from each school, and thickness of each line represents the number of faculty collaborations between the connected schools.
Sociology Professor James Moody and the team at the Duke Network Analysis Center took a similar approach, creating a network of individual faculty members who are linked by shared students. Faculty who sit on committees in only one field are bunched together, highlighting researchers who bridge different disciplines. The size of each marker represents the extent to which each researcher sits “between” two fields.
The map shows a set of strong ties within the natural sciences and within the humanities, but few links between the two groups. Moody points out that philosophy is a surprising exception to this rule, lying closer to the natural sciences cluster than to the humanities cluster.
“At Duke, the strong emphasis on philosophy of science creates a natural link between philosophy and the natural sciences,” Moody said.
Duke graduate student Aghil Abed Zadeh teamed up with Varda F. Hagh, a student at Arizona State University, to create elegant maps linking schools and departments by shared authorship. The size of each marker represents the number of publications in that school or department, and the thickness of the connecting lines indicate the number of shared authorships.
“It is interesting to see how connected law school and public policy school are. They collaborate with many of the sciences as well, which is a surprising fact,” Zadeh said. “On the other hand, we see Divinity school, one the oldest at Duke, which is isolated and not connected to others at all.”
The teams presented their visualizations Jan. 20 at the Duke Research Computing Symposium.

Post by Kara Manke